Neuronal Entropy-Rate Feature of Entopeduncular Nucleus in Rat Model of Parkinson's Disease
- PMID: 26711712
- PMCID: PMC5068970
- DOI: 10.1142/S0129065715500380
Neuronal Entropy-Rate Feature of Entopeduncular Nucleus in Rat Model of Parkinson's Disease
Abstract
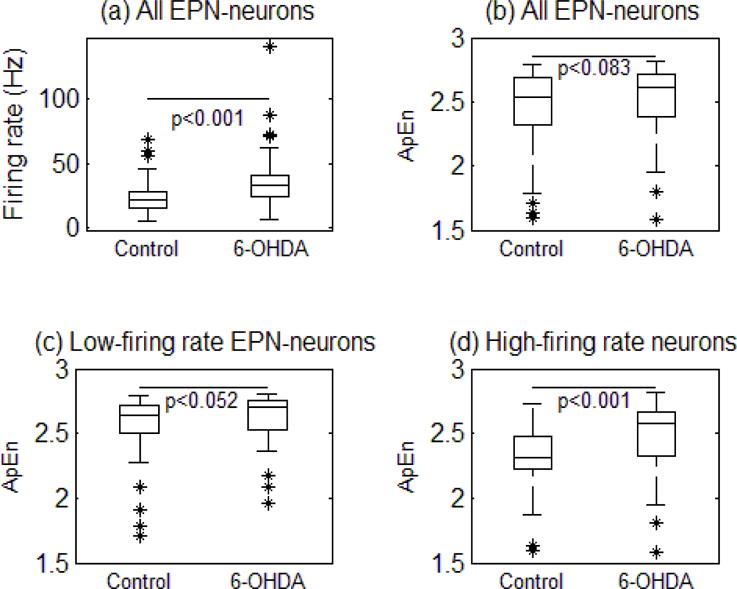
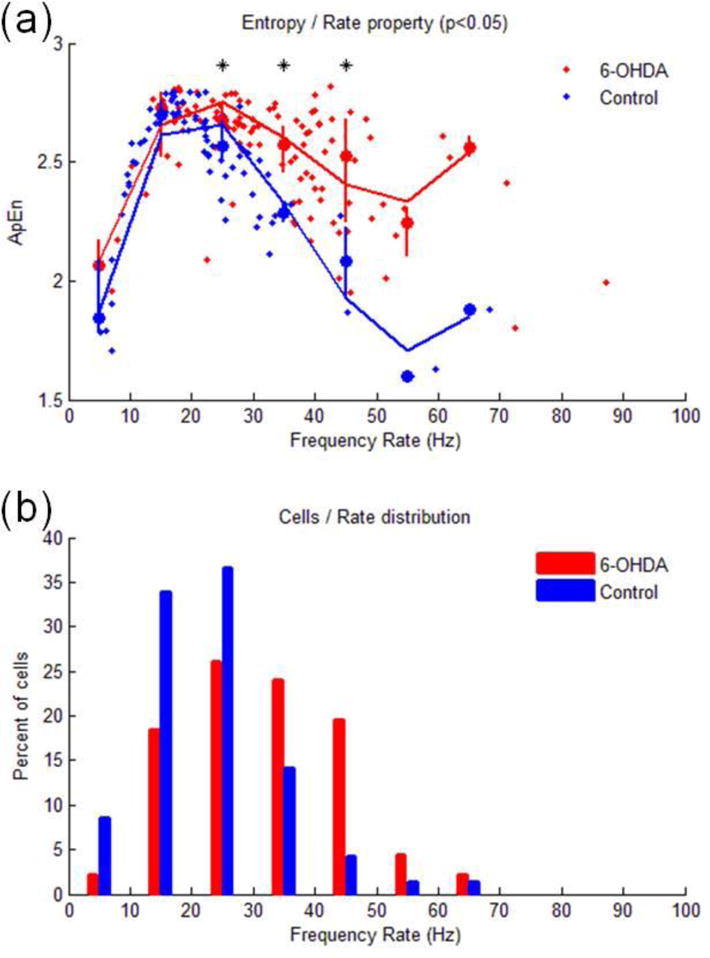
The function of the nigro-striatal pathway on neuronal entropy in the basal ganglia (BG) output nucleus, i.e. the entopeduncular nucleus (EPN) was investigated in the unilaterally 6-hyroxydopamine (6-OHDA)-lesioned rat model of Parkinson's disease (PD). In both control subjects and subjects with 6-OHDA lesion of dopamine (DA) the nigro-striatal pathway, a histological hallmark for parkinsonism, neuronal entropy in EPN was maximal in neurons with firing rates ranging between 15 and 25 Hz. In 6-OHDA lesioned rats, neuronal entropy in the EPN was specifically higher in neurons with firing rates above 25 Hz. Our data establishes that the nigro-striatal pathway controls neuronal entropy in motor circuitry and that the parkinsonian condition is associated with abnormal relationship between firing rate and neuronal entropy in BG output nuclei. The neuronal firing rates and entropy relationship provide putative relevant electrophysiological information to investigate the sensory-motor processing in normal condition and conditions such as movement disorders.
Keywords: 6-OHDA; Entropy; basal ganglia; dopamine; globus pallidus internal; rat.
Figures
Similar articles
-
Coherence of neuronal firing of the entopeduncular nucleus with motor cortex oscillatory activity in the 6-OHDA rat model of Parkinson's disease with levodopa-induced dyskinesias.Exp Brain Res. 2016 Apr;234(4):1105-18. doi: 10.1007/s00221-015-4532-1. Epub 2016 Jan 2. Exp Brain Res. 2016. PMID: 26724931
-
Acute L-DOPA administration reverses changes in firing pattern and low frequency oscillatory activity in the entopeduncular nucleus from long term L-DOPA treated 6-OHDA-lesioned rats.Exp Neurol. 2019 Dec;322:113036. doi: 10.1016/j.expneurol.2019.113036. Epub 2019 Aug 16. Exp Neurol. 2019. PMID: 31425688
-
Neuronal firing activity in the basal ganglia after striatal transplantation of dopamine neurons in hemiparkinsonian rats.Neuroscience. 2017 Sep 30;360:197-209. doi: 10.1016/j.neuroscience.2017.07.069. Epub 2017 Aug 5. Neuroscience. 2017. PMID: 28790019
-
Impact of surgery targeting the caudal intralaminar thalamic nuclei on the pathophysiological functioning of basal ganglia in a rat model of Parkinson's disease.Brain Res Bull. 2009 Feb 16;78(2-3):80-4. doi: 10.1016/j.brainresbull.2008.08.010. Epub 2008 Nov 12. Brain Res Bull. 2009. PMID: 18790021 Review.
-
Functional organization of the basal ganglia: therapeutic implications for Parkinson's disease.Mov Disord. 2008;23 Suppl 3:S548-59. doi: 10.1002/mds.22062. Mov Disord. 2008. PMID: 18781672 Review.
Cited by
-
Dopaminergic Modulation of Synaptic Integration and Firing Patterns in the Rat Entopeduncular Nucleus.J Neurosci. 2017 Jul 26;37(30):7177-7187. doi: 10.1523/JNEUROSCI.0639-17.2017. Epub 2017 Jun 26. J Neurosci. 2017. PMID: 28652413 Free PMC article.
-
Emergence of structures in neuronal network activities.Sci Rep. 2025 Jan 2;15(1):220. doi: 10.1038/s41598-024-83970-8. Sci Rep. 2025. PMID: 39747412 Free PMC article.
-
The effect of 5-HT1A receptor agonists on the entopeduncular nucleus is modified in 6-hydroxydopamine-lesioned rats.Br J Pharmacol. 2021 Jun;178(12):2516-2532. doi: 10.1111/bph.15437. Epub 2021 May 6. Br J Pharmacol. 2021. PMID: 33686657 Free PMC article.
-
Subthalamic neural entropy is a feature of freezing of gait in freely moving people with Parkinson's disease.Neurobiol Dis. 2017 Dec;108:288-297. doi: 10.1016/j.nbd.2017.09.002. Epub 2017 Sep 7. Neurobiol Dis. 2017. PMID: 28890315 Free PMC article.
-
Structure Function Revisited: A Simple Tool for Complex Analysis of Neuronal Activity.Front Hum Neurosci. 2017 Aug 14;11:409. doi: 10.3389/fnhum.2017.00409. eCollection 2017. Front Hum Neurosci. 2017. PMID: 28855866 Free PMC article.
References
-
- Mink JW. The basal ganglia: focused selection and inhibition of competing motor programs. Progress in Neurobiology. 1996;50:381–425. - PubMed
-
- Gatev P, Darbin O, Wichmann T. Oscillations in the basal ganglia under normal conditions and in movement disorders. Mov Disord. 2006;21:1566–77. - PubMed
-
- Darbin O. The aging striatal dopamine function. Parkinsonism Relat Disord. 2012;18:426–32. - PubMed
-
- Braak H, Ghebremedhin E, Rüb U, Bratzke H, Del Tredici K. Stages in the development of Parkinson’s disease-related pathology. Cell and tissue research. 2004;318:121–134. - PubMed
-
- Obeso JA, Rodriguez-Oroz MC, Rodriguez M, Lanciego JL, Artieda J, Gonzalo N, Olanow CW. Pathophysiology of the basal ganglia in Parkinson’s disease. Trends in Neurosciences. 2000;23:S8–S19. - PubMed
Publication types
MeSH terms
Grants and funding
LinkOut - more resources
Full Text Sources
Other Literature Sources
Medical