. 2016 Jan 26;113(4):1098-103.
doi: 10.1073/pnas.1508093112. Epub 2015 Dec 28.

Discontinuity in the genetic and environmental causes of the intellectual disability spectrum

Affiliations

Discontinuity in the genetic and environmental causes of the intellectual disability spectrum

Abraham Reichenberg et al. Proc Natl Acad Sci U S A. .

Erratum in

Abstract

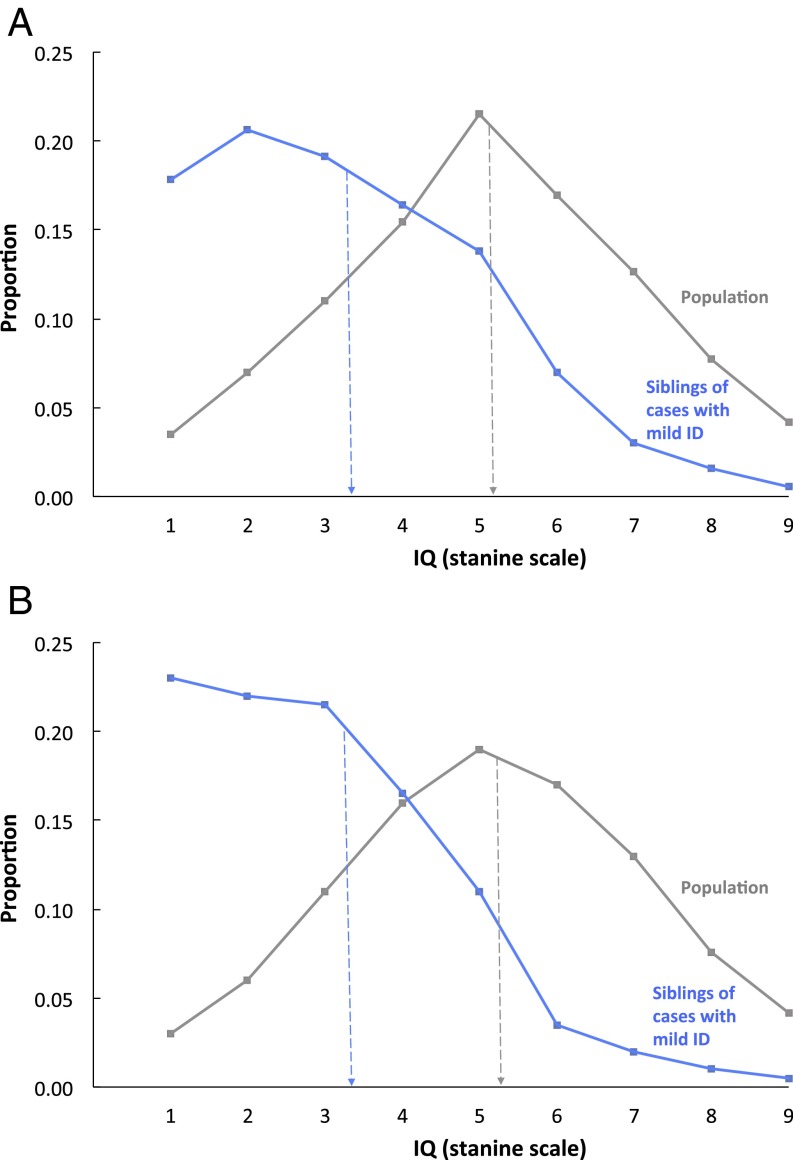
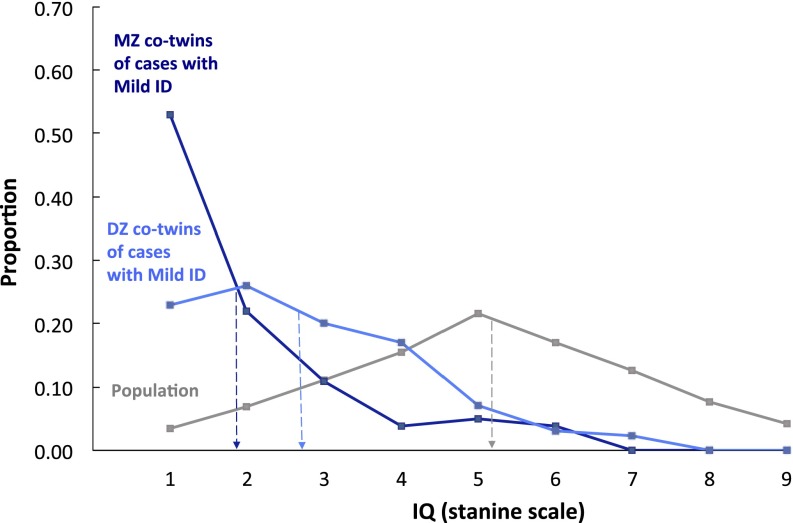
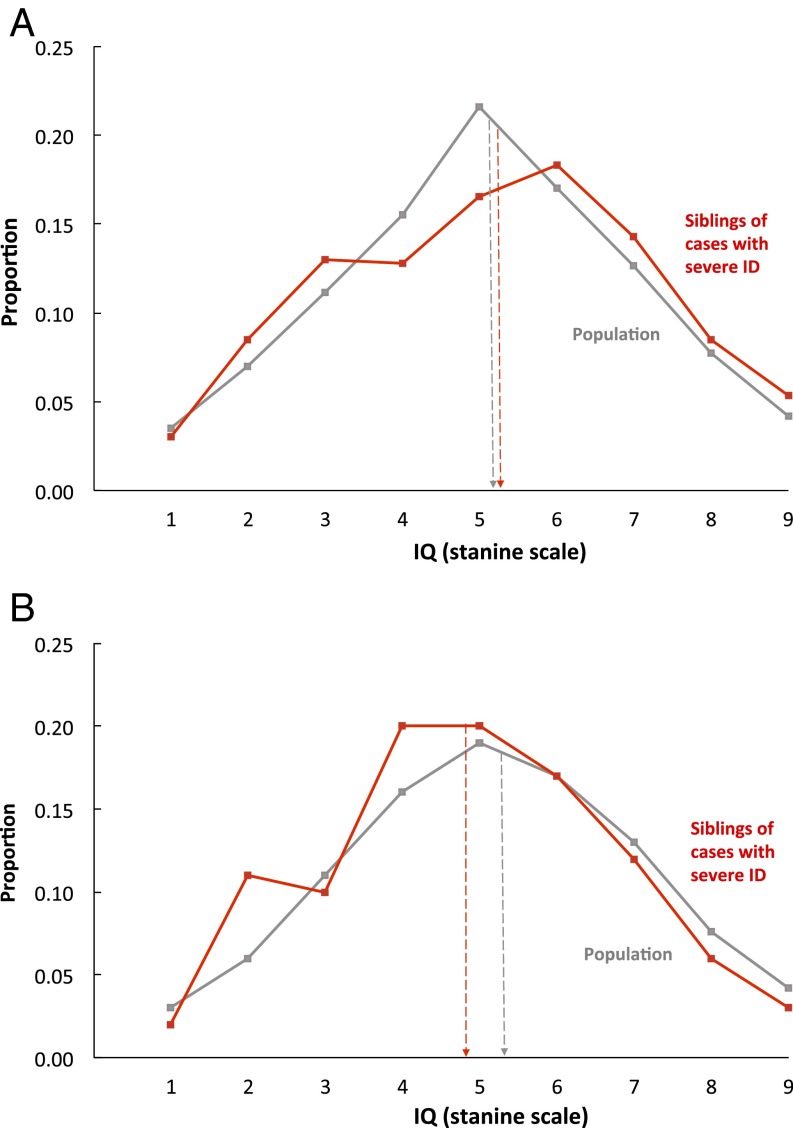
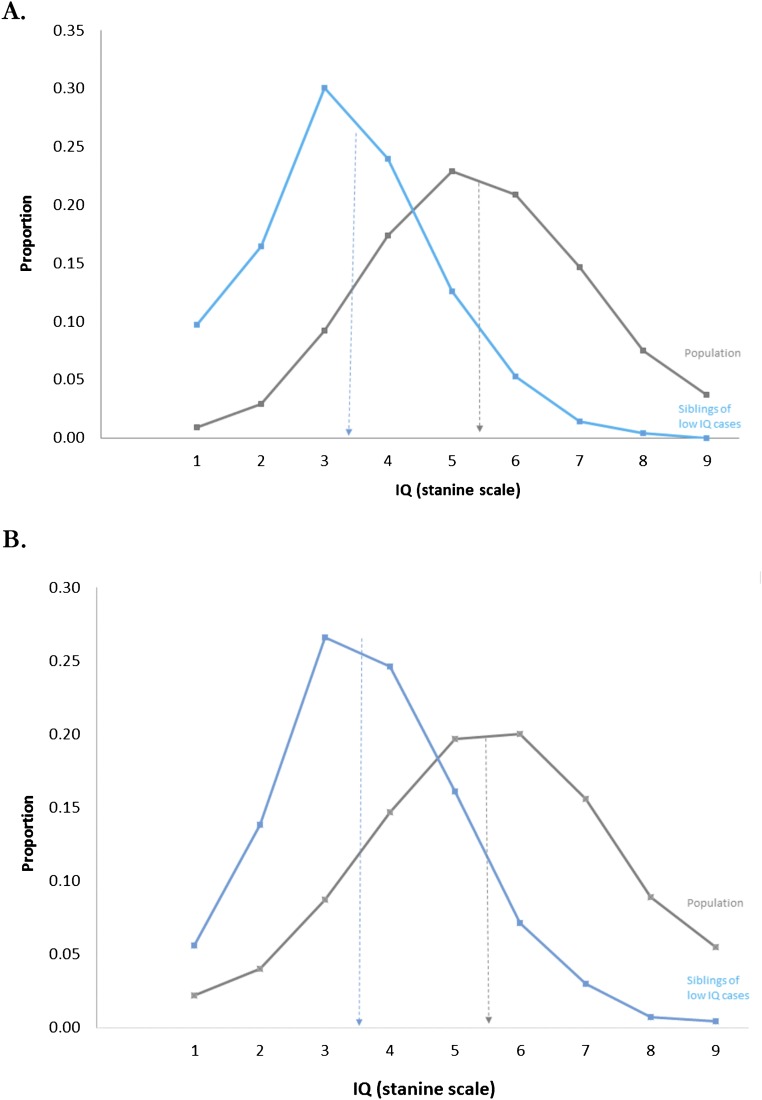
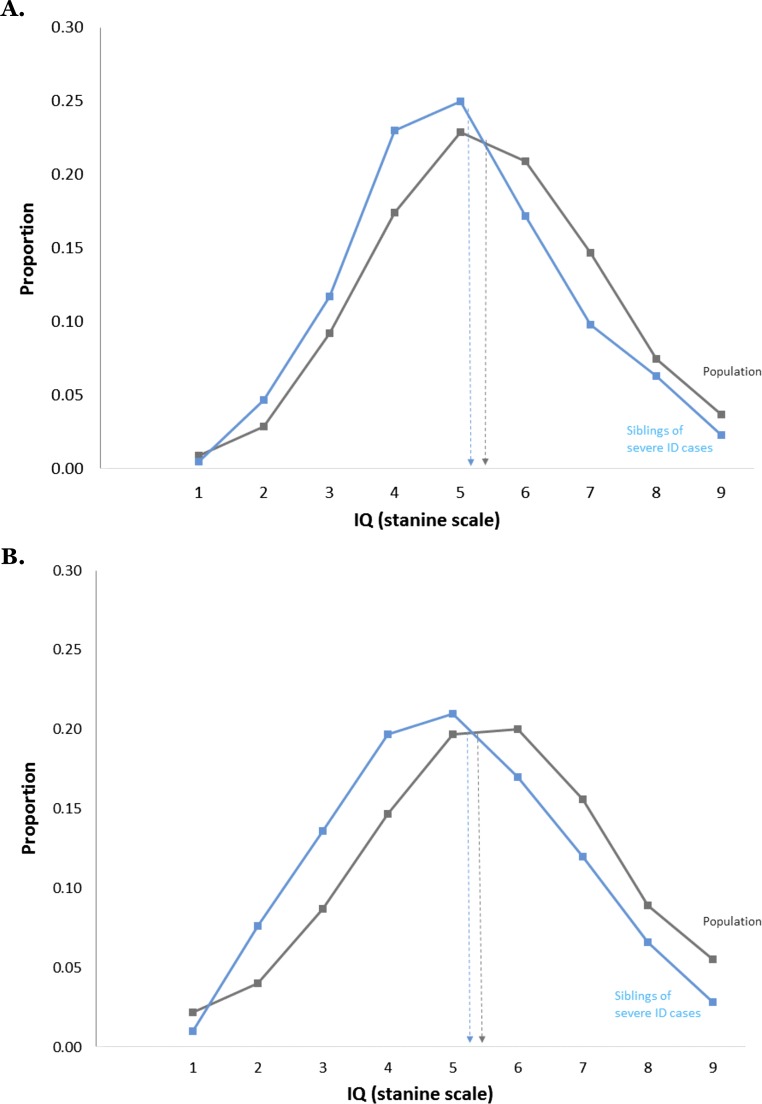
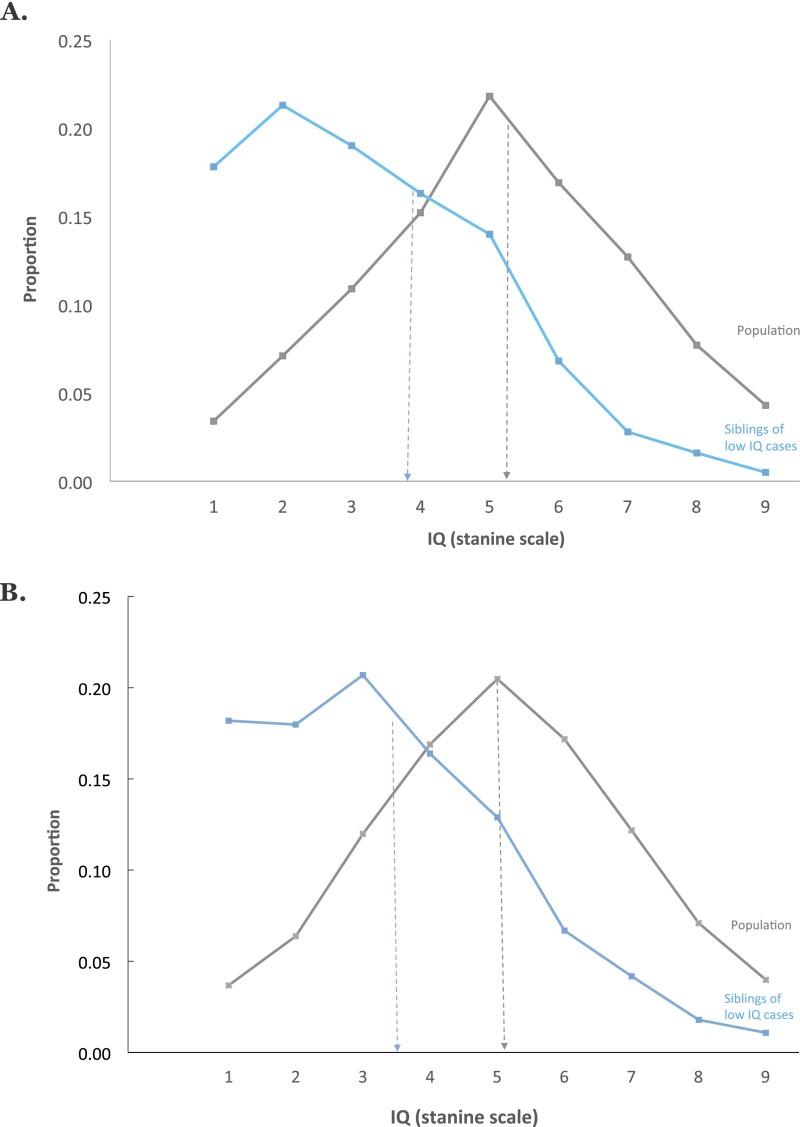
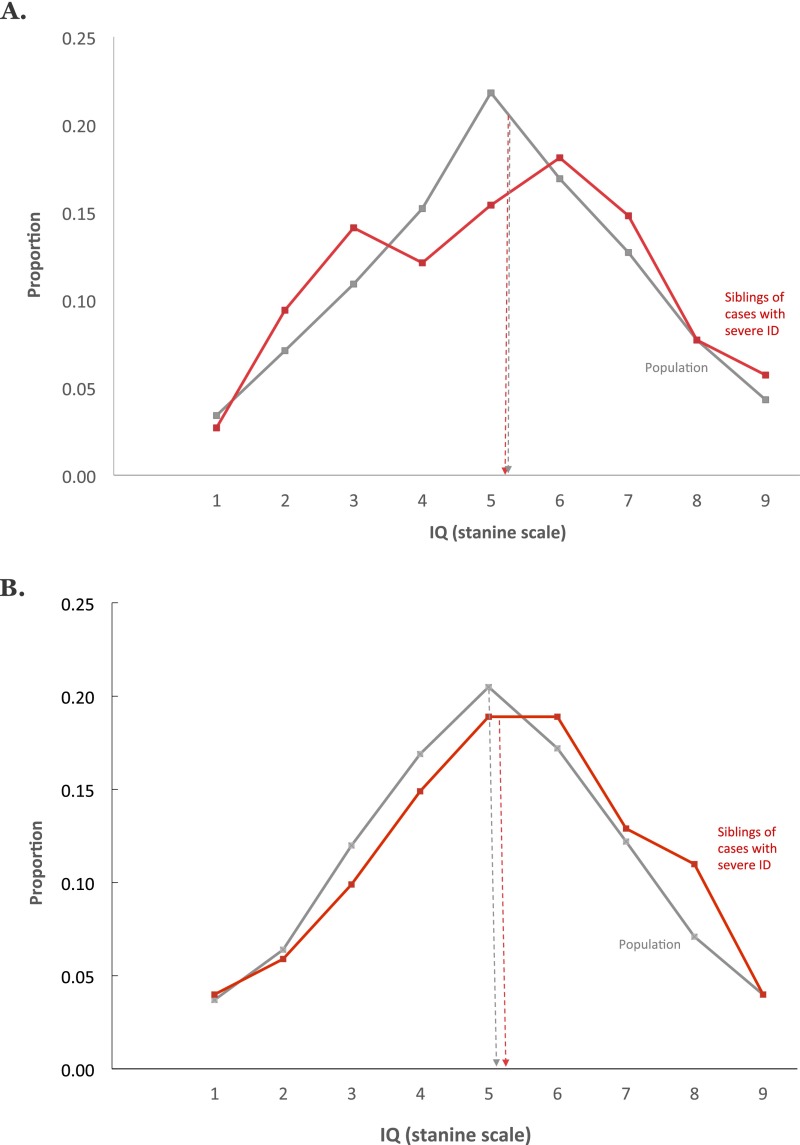
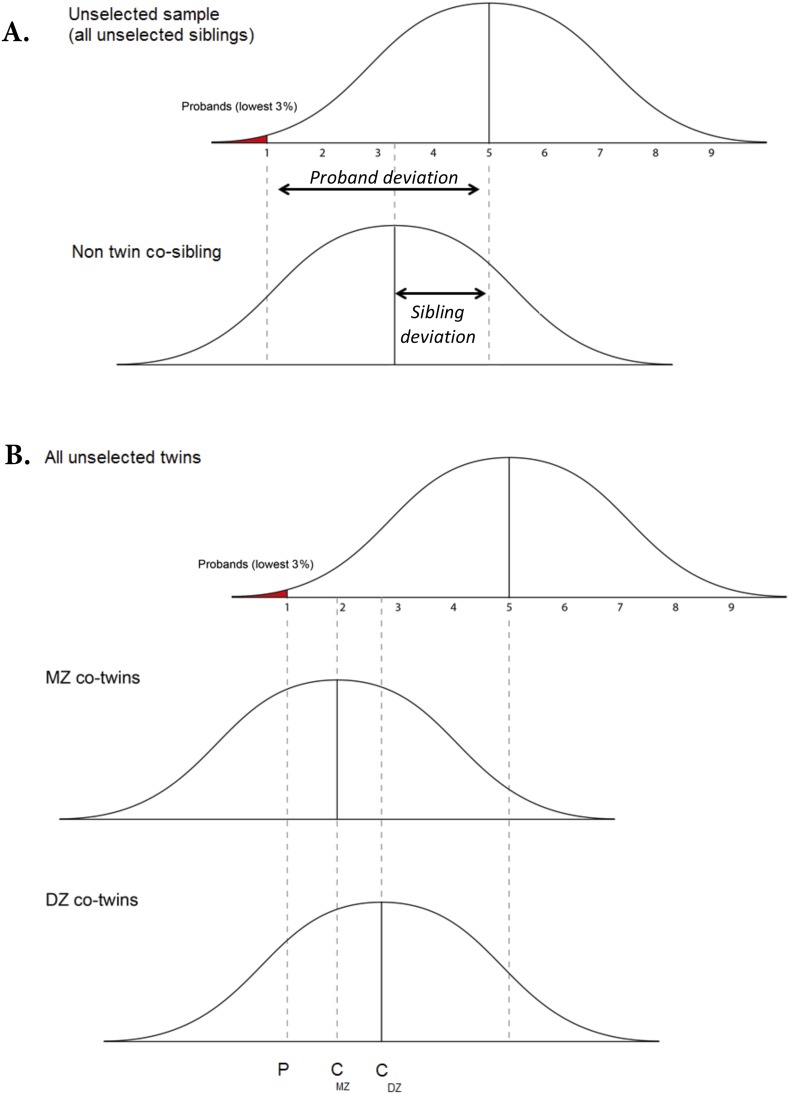
Intellectual disability (ID) occurs in almost 3% of newborns. Despite substantial research, a fundamental question about its origin and links to intelligence (IQ) still remains. ID has been shown to be inherited and has been accepted as the extreme low of the normal IQ distribution. However, ID displays a complex pattern of inheritance. Previously, noninherited rare mutations were shown to contribute to severe ID risk in individual families, but in the majority of cases causes remain unknown. Common variants associated with ID risk in the population have not been systematically established. Here we evaluate the hypothesis, originally proposed almost 1 century ago, that most ID is caused by the same genetic and environmental influences responsible for the normal distribution of IQ, but that severe ID is not. We studied more than 1,000,000 sibling pairs and 9,000 twin pairs assessed for IQ and for the presence of ID. We evaluated whether genetic and environmental influences at the extremes of the distribution are different from those operating in the normal range. Here we show that factors influencing mild ID (lowest 3% of IQ distribution) were similar to those influencing IQ in the normal range. In contrast, the factors influencing severe ID (lowest 0.5% of IQ distribution) differ from those influencing mild ID or IQ scores in the normal range. Taken together, our results suggest that most severe ID is a distinct condition, qualitatively different from the preponderance of ID, which, in turn, represents the low extreme of the normal distribution of intelligence.

Keywords: family study; heritability; intellectual disability; intelligence; twins.


Conflict of interest statement

The authors declare no conflict of interest.

Figures

Fig. 1.
Fig. 1.
Mild ID (lowest possible IQ stanine scale score of 1 equals lowest 3% IQ scores) is familial. Siblings of persons with mild ID have significantly and substantially lower IQs than the population. (A) Swedish results for male siblings of persons with IQ stanine score of 1 (mean = 3.31, SD = 1.80, n = 12,431 male pairs) and for the entire sibling population (mean = 5.10, SD = 1.95, n = 382,122 pairs). (B) Israeli results for male siblings of persons with IQ stanine score of 1 (mean = 3.36, SD = 2.46, n = 6,800 male pairs) and for the entire sibling population (mean = 5.49, SD = 1.94, n = 239,117 pairs). Note: individuals with severe ID are not included in the stanine IQ score distributions presented.
Fig. 2.
Fig. 2.
Mild ID (lowest possible IQ stanine scale score of 1 equals lowest 3% IQ scores) is heritable. MZ co-twins of mild ID cases have significantly and substantially lower IQs (mean = 1.96, SD = 1.37, n = 79 pairs) than DZ co-twins (mean = 2.78, SD = 1.52, n = 123 pairs), whose IQs are in turn lower than the population (mean = 5.10, SD = 1.95, n = 382,122 non-twin pairs). These results are from Sweden only because information on twin zygosity is not available for the Israeli sample. Note: individuals with severe ID are not included in the stanine IQ score distributions presented.
Fig. 3.
Fig. 3.
Severe ID is not familial and thus not affected by the same genetic factors as mild ID or IQ in the normal range. Siblings of persons with severe ID have IQs indistinguishable from the rest of the population. (A) Swedish results: distribution of IQ scores for individuals who have a sibling diagnosed as having severe ID (mean = 5.17, SD = 2.06, n = 400 pairs) and the entire sibling population distribution (mean = 5.10, SD = 1.95, n = 381,122 pairs). (B) Israeli results: distribution of IQ scores for individuals who have a sibling diagnosed as having severe ID (mean = 4.90, SD = 2.02, n = 297 pairs) and the entire sibling population distribution (mean = 5.49, SD = 1.94, n = 239,117 pairs). Note: individuals with severe ID are not included in the stanine IQ score distributions presented.
Fig. S1.
Fig. S1.
Mild ID (lowest 3% IQ scores) is familial in males and females. Siblings of persons with mild ID have significantly and substantially lower IQs than the population regardless of sex. (A) Israeli results for female–female siblings with IQ stanine score of 1 (mean = 3.33, SD = 2.46, n = 811 female pairs) and for the population of females (mean = 5.39, SD = 1.68, n = 120,973 pairs). (B) Israeli results for opposite-sex (female–male and male–female) siblings with IQ stanine score of 1 (mean = 3.62, SD = 1.47, n = 6,921 pairs) and for the population (mean = 5.46, SD = 1.87, n = 250,301 pairs). These results are from Israel only because only male siblings and twins are available for the Swedish sample.
Fig. S2.
Fig. S2.
Severe ID is etiologically different from mild ID and normal variation in IQ in males and females. Siblings of persons with severe ID have IQs indistinguishable from the rest of the population. (A) Israeli results: distribution of IQ scores for females who have a female sibling diagnosed with severe ID (mean = 5.04, SD = 1.65, n = 256 pairs) and the female population distribution (mean = 5.39, SD = 1.68, n = 120,973 pairs). (B) Israeli results for opposite-sex (female–male and male–female) siblings with a sibling diagnosed with severe ID (mean = 5.02, SD = 1.81, n = 1,223 pairs) and for the population (mean = 5.46, SD = 1.87, n = 250,301 pairs). These results are from Israel only because only male siblings and twins are available for the Swedish sample.
Fig. S3.
Fig. S3.
Mild ID (lowest 3% IQ scores) is familial – Sensitivity analysis. Siblings of persons with mild ID have significantly and substantially lower IQs than the population in early and in later birth cohorts in Sweden. (A) Swedish results for male siblings of persons with IQ stanine score of 1 (mean = 3.29, SD = 1.78, n = 9,324 male pairs); entire sibling population (mean = 5.11, SD = 1.95, n = 314,687 pairs) assessed before the year 2000. (B) Swedish results for male siblings of persons with IQ stanine score of 1 (mean = 3.40, SD = 1.88, n = 1,314 male pairs) and for the entire sibling population (mean = 5.04, SD = 1.94, n = 62,127 pairs) assessed in the year 2000 or later.
Fig. S4.
Fig. S4.
Severe ID is not familial: sensitivity analysis. Siblings of persons with severe ID have IQs indistinguishable from the rest of the population in early and in later birth cohorts in Sweden. (A) Swedish results for male siblings of persons diagnosed with severe ID (mean = 5.14, SD = 2.08, n = 298 pairs) and the entire sibling population distribution (mean = 5.11, SD = 1.95, n = 314,687 pairs) assessed before the year 2000. (B) Swedish results for male siblings of persons diagnosed with severe ID (mean = 5.25, SD = 2.00, n = 102 pairs) and the entire sibling population distribution (mean = 5.04, SD = 1.94, n = 62,127 pairs) assessed in the year 2000 or later.
Fig. S5.
Fig. S5.
Theoretical examples of differential regression toward the mean for (A) co-siblings and (B) MZ and DZ co-twins of probands selected for low IQ. Adapted from ref. 45. Probands are represented by the area in red. Group familiality is the ratio between the co-sibling's deviation from the population mean and the proband's deviation (Top). When group familiality for MZ twins is greater than group familiality for DZ twins (Bottom), genetic influences are implied.

References

    1. Centers for Disease Control and Prevention (CDC) Economic costs associated with mental retardation, cerebral palsy, hearing loss, and vision impairment: United States, 2003. MMWR Morb Mortal Wkly Rep. 2004;53(3):57–59. - PubMed
    1. American Psychiatric Association and American Psychiatric Association. Task Force on DSM-IV . 4th Ed. American Psychiatric Association; Washington, DC: 1994. Diagnostic and Statistical Manual of Mental Disorders: DSM-IV; p. 886.
    1. Roeleveld N, Zielhuis GA, Gabreëls F. The prevalence of mental retardation: A critical review of recent literature. Dev Med Child Neurol. 1997;39(2):125–132. - PubMed
    1. Plomin R, DeFries JC, Knopik VS, Neiderhiser JM. Behavioral Genetics. 6th Ed Worth Publishers, New York: 2012.
    1. de Ligt J, et al. Diagnostic exome sequencing in persons with severe intellectual disability. N Engl J Med. 2012;367(20):1921–1929. - PubMed

Publication types

LinkOut - more resources