. 2016 Feb 23;113(8):E1074-81.
doi: 10.1073/pnas.1507110112. Epub 2015 Dec 28.

Whole-brain calcium imaging with cellular resolution in freely behaving Caenorhabditis elegans

Affiliations

Whole-brain calcium imaging with cellular resolution in freely behaving Caenorhabditis elegans

Jeffrey P Nguyen et al. Proc Natl Acad Sci U S A. .

Abstract

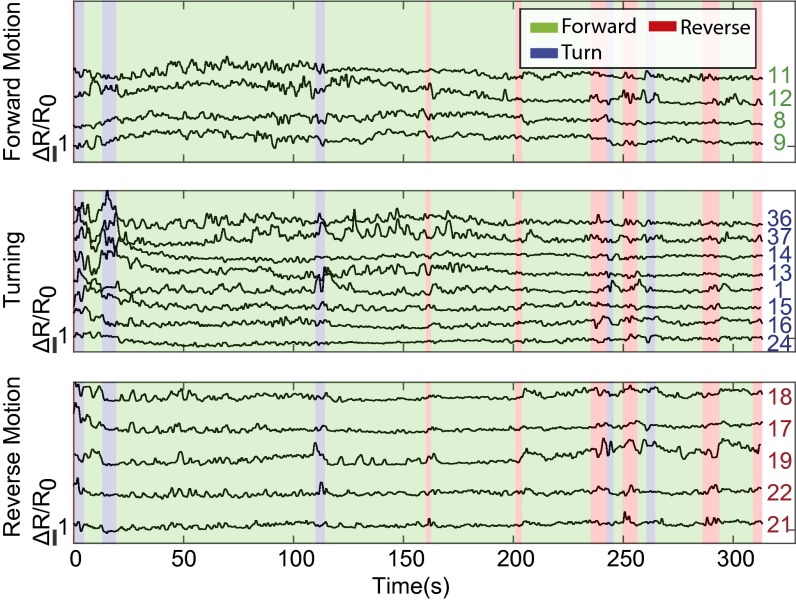
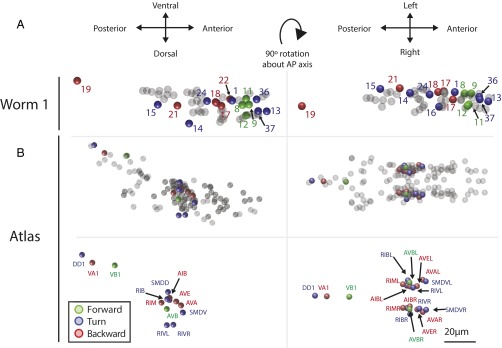
The ability to acquire large-scale recordings of neuronal activity in awake and unrestrained animals is needed to provide new insights into how populations of neurons generate animal behavior. We present an instrument capable of recording intracellular calcium transients from the majority of neurons in the head of a freely behaving Caenorhabditis elegans with cellular resolution while simultaneously recording the animal's position, posture, and locomotion. This instrument provides whole-brain imaging with cellular resolution in an unrestrained and behaving animal. We use spinning-disk confocal microscopy to capture 3D volumetric fluorescent images of neurons expressing the calcium indicator GCaMP6s at 6 head-volumes/s. A suite of three cameras monitor neuronal fluorescence and the animal's position and orientation. Custom software tracks the 3D position of the animal's head in real time and two feedback loops adjust a motorized stage and objective to keep the animal's head within the field of view as the animal roams freely. We observe calcium transients from up to 77 neurons for over 4 min and correlate this activity with the animal's behavior. We characterize noise in the system due to animal motion and show that, across worms, multiple neurons show significant correlations with modes of behavior corresponding to forward, backward, and turning locomotion.

Keywords: C. elegans; behavior; calcium imaging; large-scale recording; microscopy.


Conflict of interest statement

The authors declare no conflict of interest.

Figures

Fig. 1.
Fig. 1.
Simultaneous imaging of whole-brain calcium activity and behavior, simplified schematic. A worm crawls freely on a motorized stage under near-infrared (NIR) dark-field illumination. A spinning disk confocal microscope acquires volumetric fluorescent images of the worm’s brain by scanning a 40× objective along the imaging axis (z) to acquire 6 brain volumes/s. A low-magnification 10× objective images the animal’s posture and behavior. Custom 3D real-time tracking software feeds back on the fluorescence images and adjusts the xy motorized stage and z-piezo stage accordingly to keep the worm’s head centered in the high magnification objective’s field of view.
Fig. 2.
Fig. 2.
Simultaneous recording of four video streams showing behavior and neural activity. (A) The worm’s posture and behavior are recorded via infrared (IR) darkfield imaging through the 10× objective at 42 fps. (B) Fluorescence from neurons in the worm’s head is tracked in real time to keep the worm centered in the field of view, via the 10× objective at 67 fps. (Scale bar, 100 μm.) Orange line indicates the worm’s centerline. (C–F) Fluorescence images of neuronal nuclei are simultaneously recorded through the 40× objective at 200 fps as the objective scans through the worm’s head along the axial imaging axis, z. A 3D volume is reconstructed from a z-stack of acquired images. (Scale bars, 10 μm.) (C and E) Individual xy, xz, and zy slices are shown for (C) RFP and (E) GCaMP6s. White dashed line indicates approximate outline of the worm’s head. (D and F) Maximum intensity projection of the same volume is shown for (D) RFP and (F) GCaMP6s.
Fig. 3.
Fig. 3.
The worm’s behavior is recorded during imaging. Data from worm 1 is shown. The worm’s (A) center-of-mass trajectory, body shape, and (B) velocity in the anterior direction are shown. (C) An ethogram describing the behavior is generated automatically from the worm’s posture and behavior (SI Appendix, Methods).
Fig. 4.
Fig. 4.
Recordings from two of four individuals are shown containing neural activity from 56 and 77 neurons, respectively. Additional recordings are shown in SI Appendix, Fig. S3. The ratio of GCaMP6s fluorescence to RFP fluorescence for each neuron is plotted. The ratio of fluorescent intensities, R, is represented as the fractional change in ΔR/R0, where the baseline R0 is defined for each neuron as the lower 20th percentile value. Neurons are sorted via a hierarchical clustering algorithm. Corresponding correlations are shown in Fig. 5. Behavioral ethograms are shown. Neural data from worm 1 corresponds to the same recording as in Fig. 3. Note, neural ID numbers do not indicate correspondence across worms. Occasional white gaps in the data represent instances when the neuron is obscured or transiently leaves the field of view (SI Appendix, Methods).
Fig. 5.
Fig. 5.
Correlations between calcium activity of neurons from two worms are shown. Data correspond to neural activity shown in Fig. 4. Correlation values are hierarchically clustered using a Euclidean distance metric so that neurons with similar activity are organized together. Additional worms are shown in SI Appendix, Fig. S6.
Fig. 6.
Fig. 6.
Transients observed from 63 neurons in a freely moving GFP control worm. Fractional change from baseline, ΔR/R0, of the ratio between green- and red-channel fluorescence of 63 neurons in a control worm expressing GFP and RFP in the nuclei is shown. Neural activity was extracted using the same analysis pipeline as for GCaMP worms. Color map is identical to that in Fig. 4 and SI Appendix, Fig. S3.
Fig. 7.
Fig. 7.
Comparison between GCaM6s individuals and GFP control worm. (A) The distribution of fractional change of ratios of fluorescent intensity values, ΔR/R0, of all neurons recorded during free behavior is shown for the four GCaMP6s worms (red) and a control GFP worm (blue). Note, this population of neurons likely includes silent as well as active neurons. GCaMP6s had larger mean and SD in its time-varying fluctuations of ratios of fluorescent intensity ΔR/R0GCaMP=0.2, σGCaMP=0.26 than that of the GFP control worm ΔR/R0GFP=0.14, σGFP=0.15. This is consistent with GCaMP6s’ role as a calcium indicator and suggests that the time varying fluorescence we observe is not merely due to motion artifact. (B) Fraction of observed neurons whose activity correlated with forward (green), turning (blue), or reverse behavior (red) above a significance threshold is shown for the four GCaMP6s individuals and the GFP control worm. Numerals refer to the number of neurons that correlated with each behavior. Number of neurons that correlate with any of the three behaviors out of total neurons observed is shown above each bar.
Fig. 8.
Fig. 8.
All neurons whose activity correlated with either forward, turning, or reverse behavior above a significance threshold are shown for worm 1. The significance threshold was calibrated to the noise observed in the GFP control recordings. Vertical scale bar indicates ΔR/R0 of 1 (100%). Each neuron’s ID number is indicated. Note neuron numbers do not indicate correspondence across worms. Additional individuals are shown in SI Appendix, Fig. S9.
Fig. 9.
Fig. 9.
The position of recorded neurons for worm 1 is plotted in 3D and compared with an atlas. (Left) Dorsal-ventral plane view of the animal. (Right) Left-right plane view of the animal. (A) Neurons whose activity correspond to forward, turning, or reverse are colored and labeled with a neuron ID corresponding to Fig. 4. Remaining neurons are shaded gray. Additional worms are shown in SI Appendix, Fig. S10. (B) The position of all known neurons are plotted using reference data culled from the WormBase Virtual Worm Project. Neurons that have previously been reported in the literature as implicated in a behavior are colored accordingly (SI Appendix, Table S5) and labeled with their neuron name. Colored neurons are shown both in and out of context of all other neurons for clarity.

Comment in

  • Grabbing brain activity on the go.
    Clandinin TR, Goodman MB. Clandinin TR, et al. Proc Natl Acad Sci U S A. 2016 Feb 23;113(8):1965-7. doi: 10.1073/pnas.1524219113. Epub 2016 Feb 3. Proc Natl Acad Sci U S A. 2016. PMID: 26842834 Free PMC article. No abstract available.

References

    1. Maynard EM, et al. Neuronal interactions improve cortical population coding of movement direction. J Neurosci. 1999;19(18):8083–8093. - PMC - PubMed
    1. Long MA, Jin DZ, Fee MS. Support for a synaptic chain model of neuronal sequence generation. Nature. 2010;468(7322):394–399. - PMC - PubMed
    1. Briggman KL, Abarbanel HDI, Kristan WBJ., Jr Optical imaging of neuronal populations during decision-making. Science. 2005;307(5711):896–901. - PubMed
    1. Harvey CD, Coen P, Tank DW. Choice-specific sequences in parietal cortex during a virtual-navigation decision task. Nature. 2012;484(7392):62–68. - PMC - PubMed
    1. Chen TW, et al. Ultrasensitive fluorescent proteins for imaging neuronal activity. Nature. 2013;499(7458):295–300. - PMC - PubMed

Publication types