. 2016 Jan 12;113(2):E249-55.
doi: 10.1073/pnas.1523397113. Epub 2015 Dec 28.

Progressive forest canopy water loss during the 2012-2015 California drought

Affiliations

Progressive forest canopy water loss during the 2012-2015 California drought

Gregory P Asner et al. Proc Natl Acad Sci U S A. .

Abstract

The 2012-2015 drought has left California with severely reduced snowpack, soil moisture, ground water, and reservoir stocks, but the impact of this estimated millennial-scale event on forest health is unknown. We used airborne laser-guided spectroscopy and satellite-based models to assess losses in canopy water content of California's forests between 2011 and 2015. Approximately 10.6 million ha of forest containing up to 888 million large trees experienced measurable loss in canopy water content during this drought period. Severe canopy water losses of greater than 30% occurred over 1 million ha, affecting up to 58 million large trees. Our measurements exclude forests affected by fire between 2011 and 2015. If drought conditions continue or reoccur, even with temporary reprieves such as El Niño, we predict substantial future forest change.

Keywords: canopy water; climate change; drought; forest health; imaging spectroscopy.


Conflict of interest statement

The authors declare no conflict of interest.

Figures
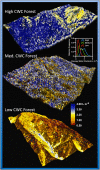
Fig. 1.
Fig. 1.
Example CAO images of forest 3D canopy water content (CWC) highlighting landscapes of about 1,000 ha each, with high, medium, and low CWC. (Inset) Graph shows the frequency distribution of CWC in liters of water per square meter (L/m2). These landscape examples were taken from Muir Woods National Monument (high CWC), Sequoia-Kings Canyon National Park (medium CWC), and Los Padres National Forest (low CWC). Field and airborne observations, as well as US Forest Service studies (7), indicate massive mortality in the low CWC landscape shown.
Fig. 2.
Fig. 2.
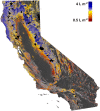
Forest canopy water content (CWC) reported in liters per square meter for the state of California as of August 2015. Black areas indicate fire extents reported between 2011 and 2015 by the US Forest Service (31).
Fig. 3.
Fig. 3.
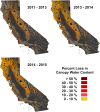
Forest canopy water loss from 2011 to 2013, 2013 to 2014, and 2014 to 2015. Black areas indicate fire extents reported between 2011 and 2015 by the US Forest Service (31).
Fig. 4.
Fig. 4.
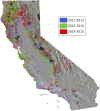
The geography of forest canopy water loss from 2011 to 2015, partitioned spatially by onset period of observation. Only water losses of at least 5% are displayed. Black areas indicate fire extents reported between 2011 and 2015 by the US Forest Service (31).
Fig. 5.
Fig. 5.
(A) Mapped forest areas of decreases in canopy water content between 2011–2013, 2013–2014, and 2014–2015. (B) Estimated maximum number of trees (≥12.7 cm or 5 inches diameter at breast height) affected for each observation interval.
Fig. 6.
Fig. 6.
Progressive forest canopy water stress for the years 2011–2015, computed as the total percentage CWC loss for the study period. Inset graph indicates the mapped forest area and estimated maximum number of trees (≥12.7 cm or 5 inches diameter at breast height) affected in differing CWC loss classes. Black areas indicate fire extents reported between 2011 and 2015 by the US Forest Service (31).

References

    1. Robeson SM. Revisiting the recent California drought as an extreme value. Geophys Res Lett. 2015;42(16):6771–6779.
    1. Brown EG. State of California Proclamation of a State of Emergency. Executive Department, State of California; Sacramento, CA: 2015.
    1. Williams AP, et al. 2015. Contribution of anthropogenic warming to California drought during 2012-2014. Geophys Res Lett, 42(16):6819–6828.
    1. Diffenbaugh NS, Swain DL, Touma D. Anthropogenic warming has increased drought risk in California. Proc Natl Acad Sci USA. 2015;112(13):3931–3936. - PMC - PubMed
    1. Allen CD, et al. A global overview of drought and heat-induced tree mortality reveals emerging climate change risks for forests. For Ecol Manage. 2010;259(4):660–684.

Publication types