

Genetic contributions to circadian activity rhythm and sleep pattern phenotypes in pedigrees segregating for severe bipolar disorder
- PMID: 26712028
- PMCID: PMC4760829
- DOI: 10.1073/pnas.1513525113
Genetic contributions to circadian activity rhythm and sleep pattern phenotypes in pedigrees segregating for severe bipolar disorder
Abstract
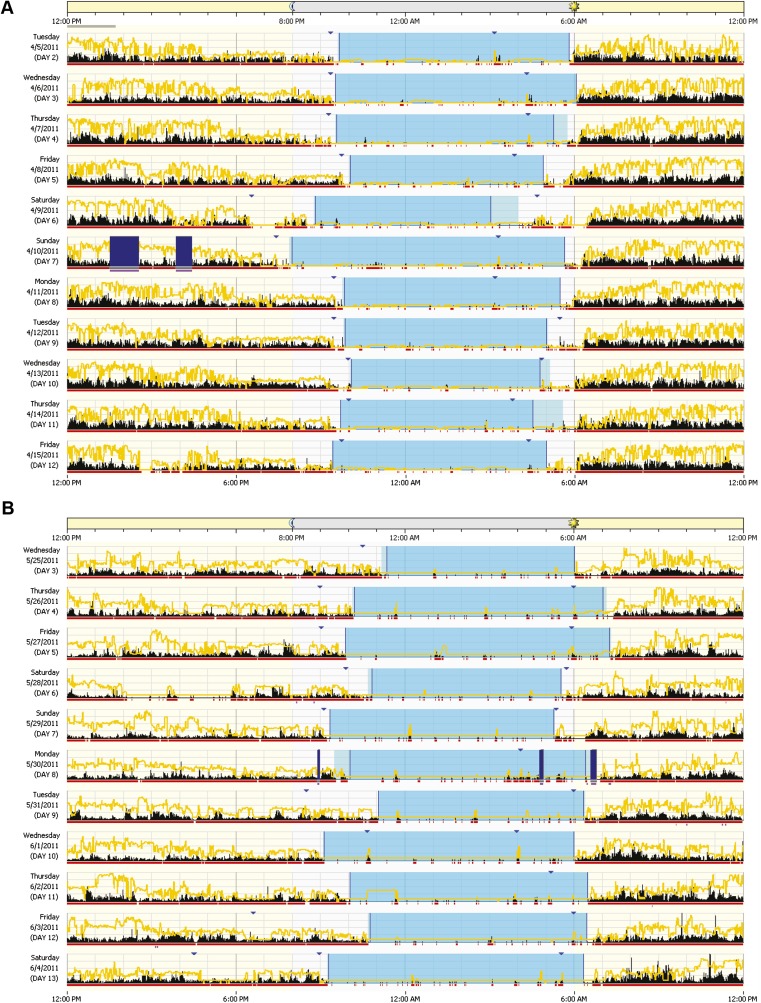
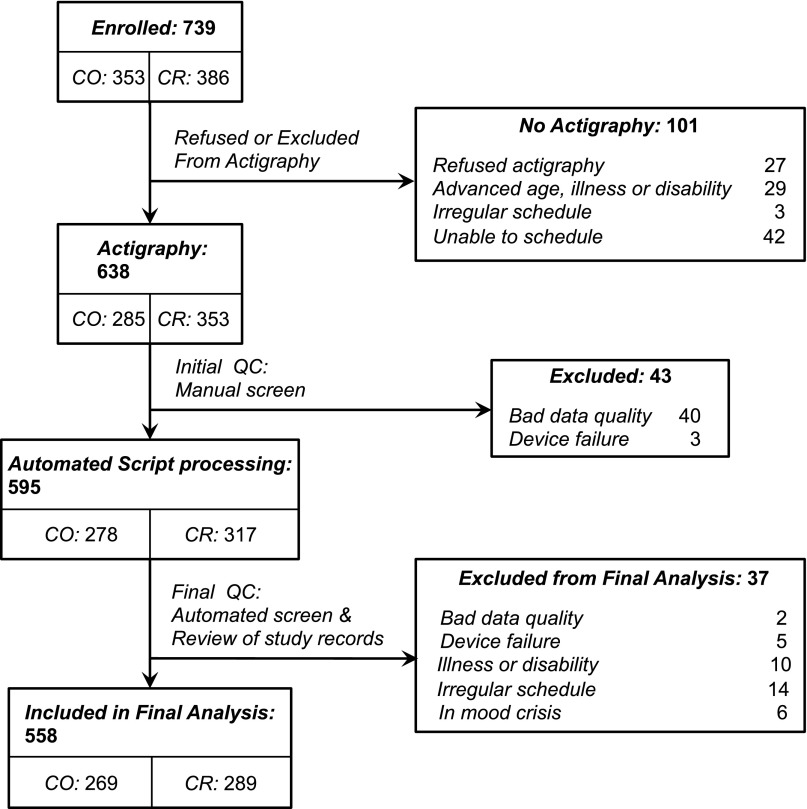
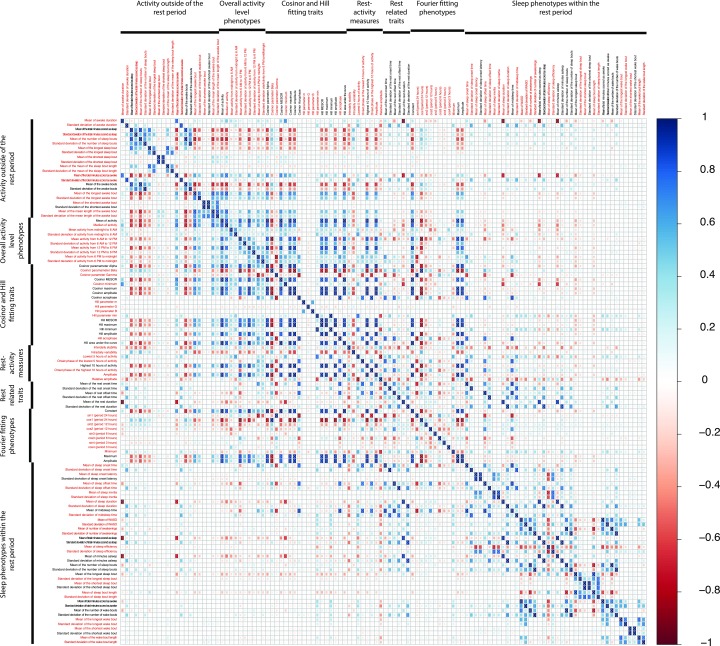
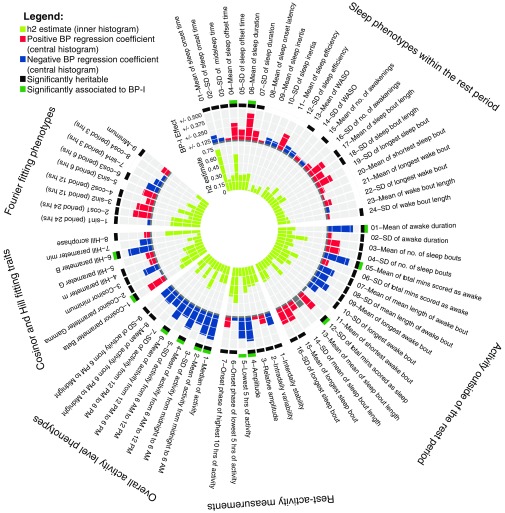
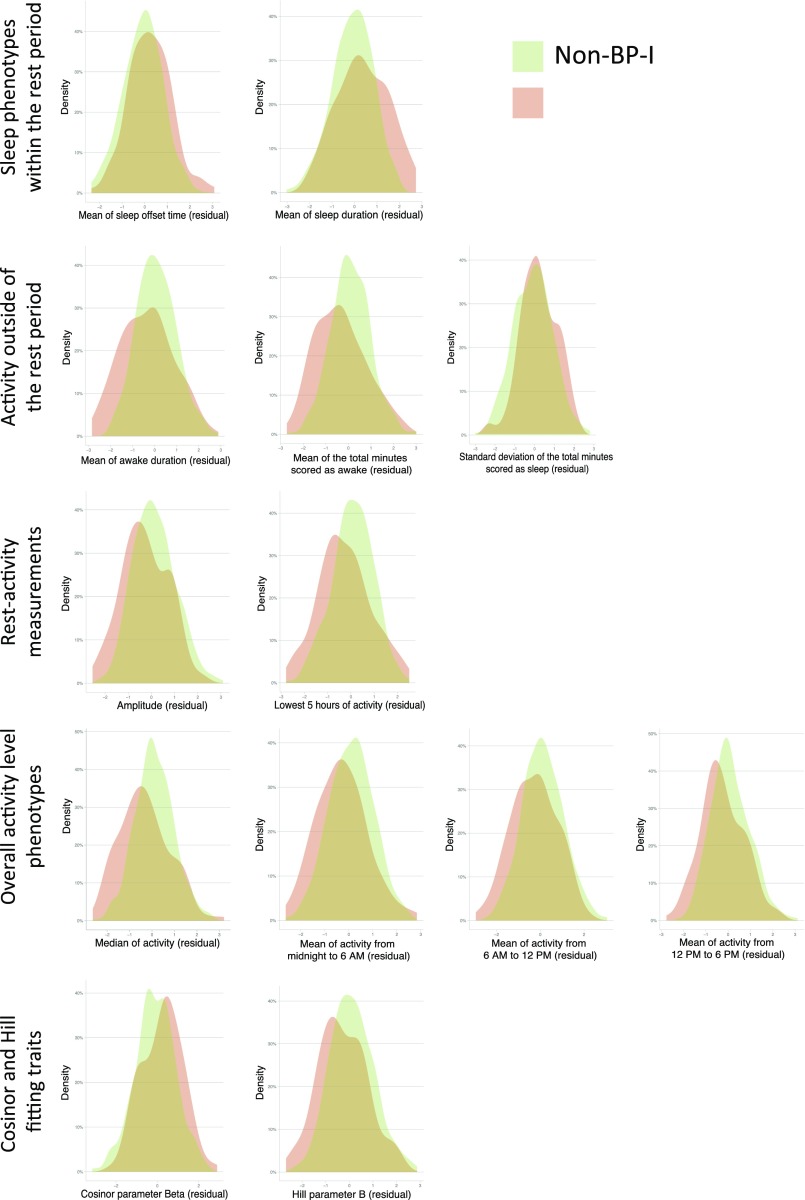
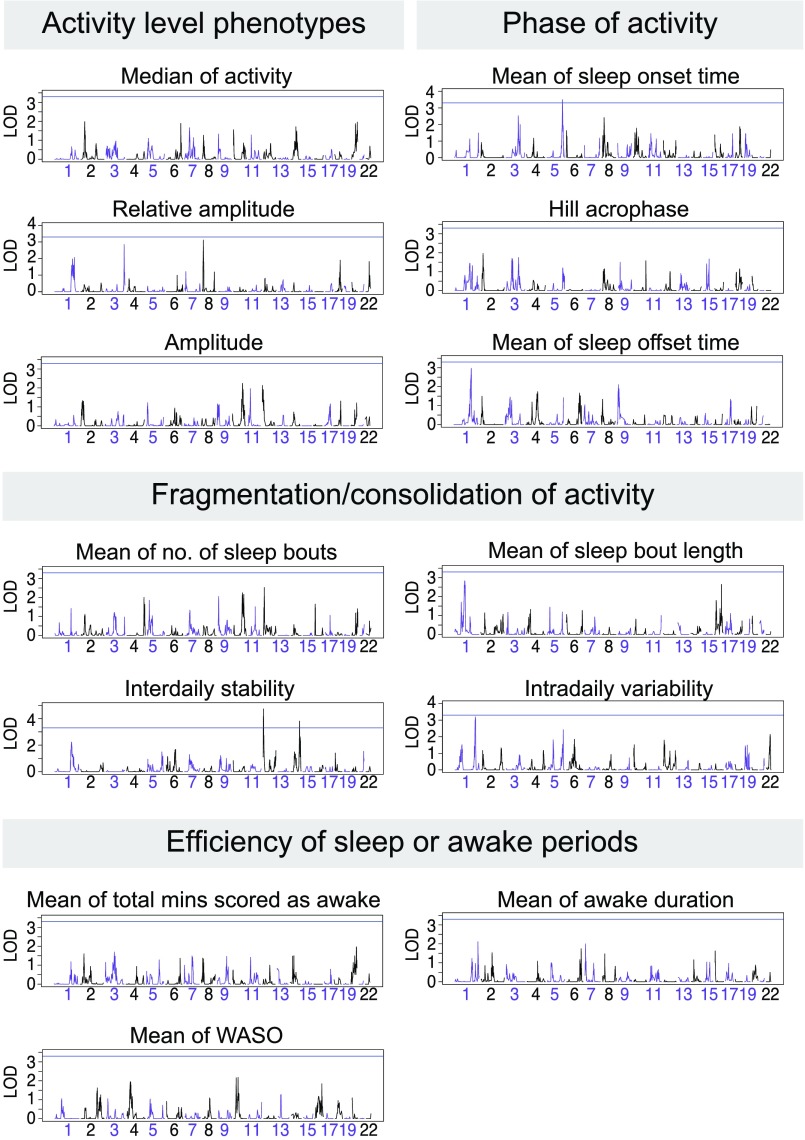
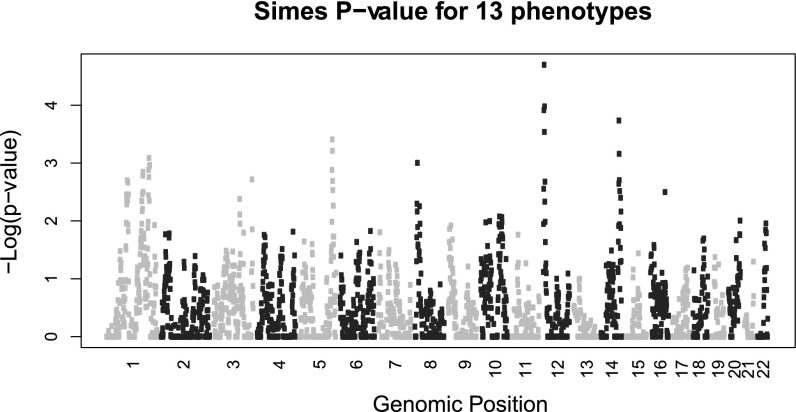
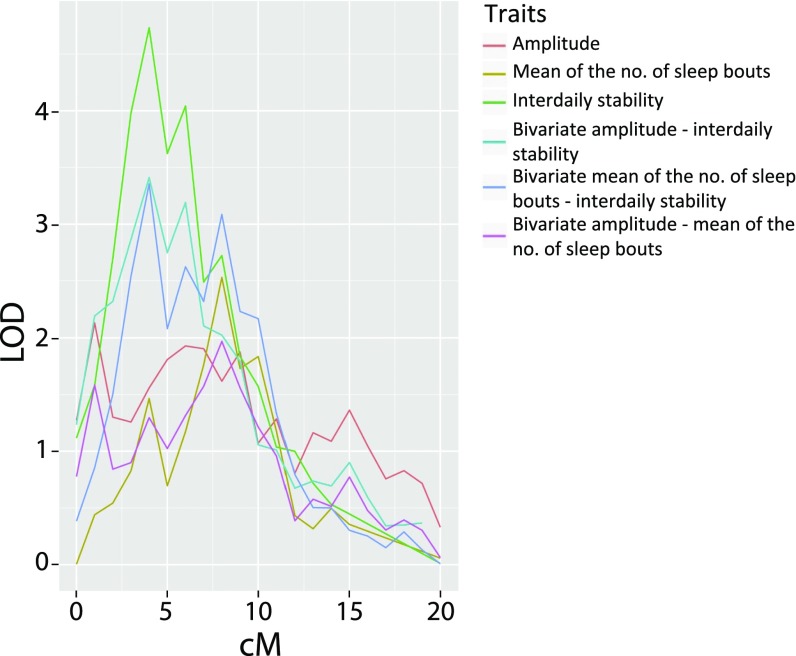
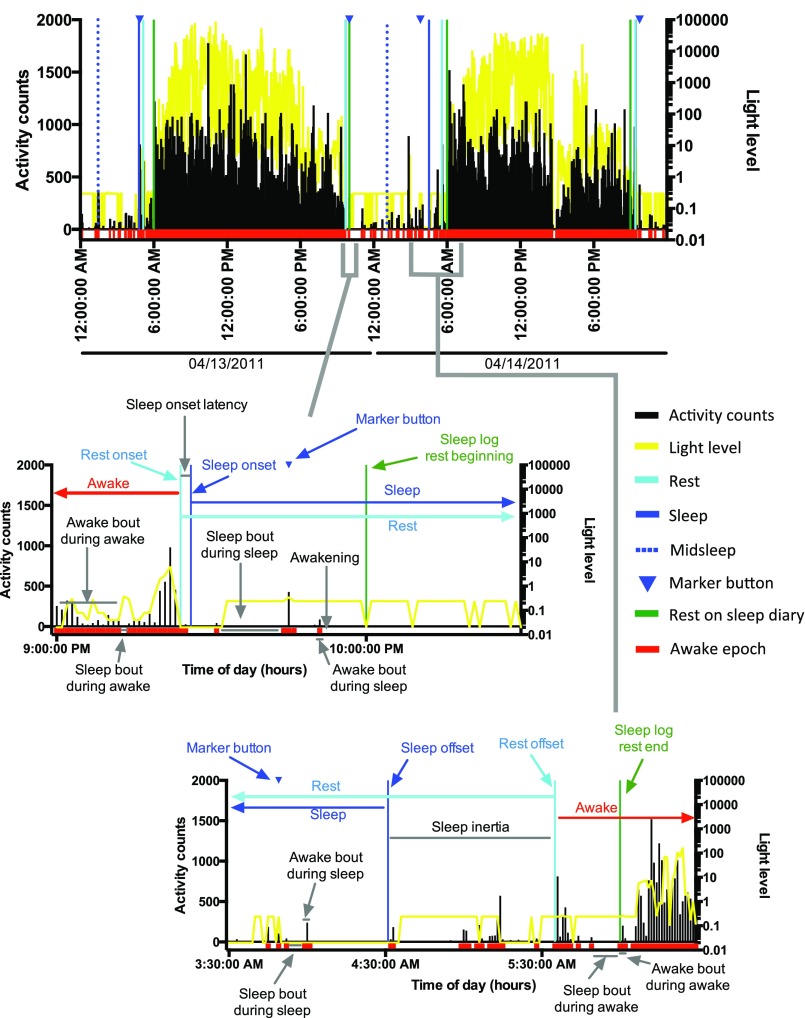
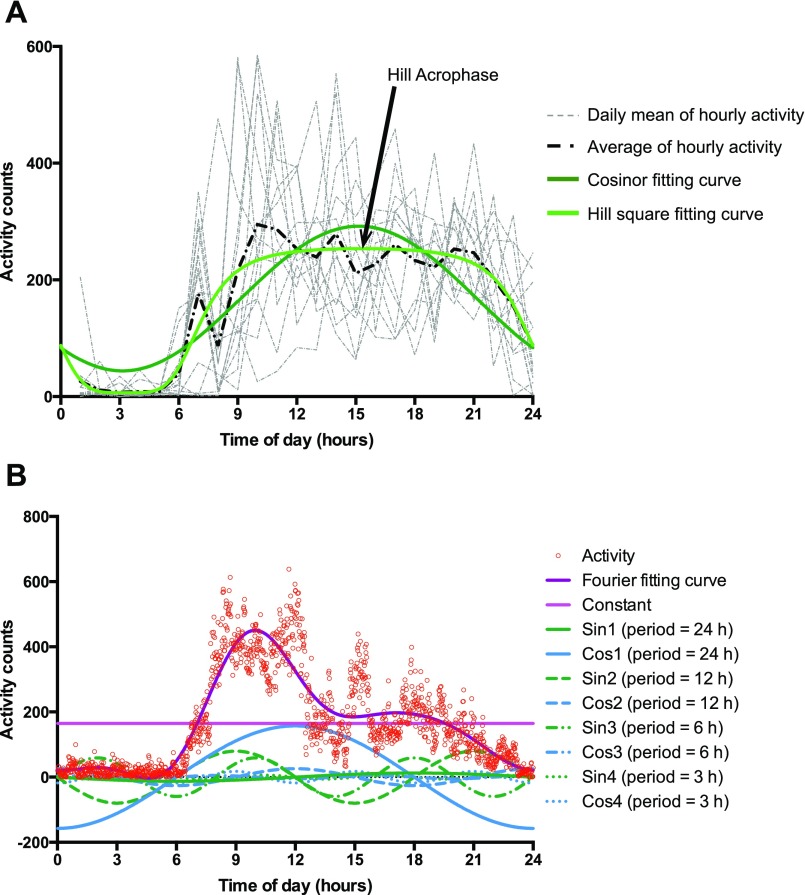
Abnormalities in sleep and circadian rhythms are central features of bipolar disorder (BP), often persisting between episodes. We report here, to our knowledge, the first systematic analysis of circadian rhythm activity in pedigrees segregating severe BP (BP-I). By analyzing actigraphy data obtained from members of 26 Costa Rican and Colombian pedigrees [136 euthymic (i.e., interepisode) BP-I individuals and 422 non-BP-I relatives], we delineated 73 phenotypes, of which 49 demonstrated significant heritability and 13 showed significant trait-like association with BP-I. All BP-I-associated traits related to activity level, with BP-I individuals consistently demonstrating lower activity levels than their non-BP-I relatives. We analyzed all 49 heritable phenotypes using genetic linkage analysis, with special emphasis on phenotypes judged to have the strongest impact on the biology underlying BP. We identified a locus for interdaily stability of activity, at a threshold exceeding genome-wide significance, on chromosome 12pter, a region that also showed pleiotropic linkage to two additional activity phenotypes.
Keywords: actigraphy; behavior; bipolar disorder; circadian rhythms; endophenotypes.
Conflict of interest statement
The authors declare no conflict of interest.
Figures
Comment in
-
Expanding the phenotype half of the genotype-phenotype space.Proc Natl Acad Sci U S A. 2016 Feb 9;113(6):1477-9. doi: 10.1073/pnas.1525363113. Epub 2016 Jan 29. Proc Natl Acad Sci U S A. 2016. PMID: 26825113 Free PMC article. No abstract available.
References
-
- Jackson A, Cavanagh J, Scott J. A systematic review of manic and depressive prodromes. J Affect Disord. 2003;74(3):209–217. - PubMed
-
- Leibenluft E, Albert PS, Rosenthal NE, Wehr TA. Relationship between sleep and mood in patients with rapid-cycling bipolar disorder. Psychiatry Res. 1996;63(2-3):161–168. - PubMed
-
- Benedetti F, Barbini B, Colombo C, Smeraldi E. Chronotherapeutics in a psychiatric ward. Sleep Med Rev. 2007;11(6):509–522. - PubMed
-
- Linkowski P. EEG sleep patterns in twins. J Sleep Res. 1999;8(Suppl 1):11–13. - PubMed
-
- De Gennaro L, et al. The electroencephalographic fingerprint of sleep is genetically determined: A twin study. Ann Neurol. 2008;64(4):455–460. - PubMed
Publication types
MeSH terms
Grants and funding
- K23 MH074644/MH/NIMH NIH HHS/United States
- T32 MH073526/MH/NIMH NIH HHS/United States
- T32MH073526/MH/NIMH NIH HHS/United States
- R01 MH095454/MH/NIMH NIH HHS/United States
- K08 MH086786/MH/NIMH NIH HHS/United States
- P30 NS062691/NS/NINDS NIH HHS/United States
- R01MH075007/MH/NIMH NIH HHS/United States
- P30NS062691/NS/NINDS NIH HHS/United States
- R01MH095454/MH/NIMH NIH HHS/United States
- K23MH074644-01/MH/NIMH NIH HHS/United States
- HHMI/Howard Hughes Medical Institute/United States
- K08MH08/MH/NIMH NIH HHS/United States
- R01 MH075007/MH/NIMH NIH HHS/United States
- R01 MH113078/MH/NIMH NIH HHS/United States
- R01 HG006695/HG/NHGRI NIH HHS/United States
LinkOut - more resources
Full Text Sources
Other Literature Sources
Medical
