. 2016 Feb;6(1):1-16.
doi: 10.1007/s13346-015-0269-4.

Colorectal delivery and retention of PEG-Amprenavir-Bac7 nanoconjugates--proof of concept for HIV mucosal pre-exposure prophylaxis

Affiliations

Colorectal delivery and retention of PEG-Amprenavir-Bac7 nanoconjugates--proof of concept for HIV mucosal pre-exposure prophylaxis

Mahta Samizadeh et al. Drug Deliv Transl Res. 2016 Feb.

Abstract

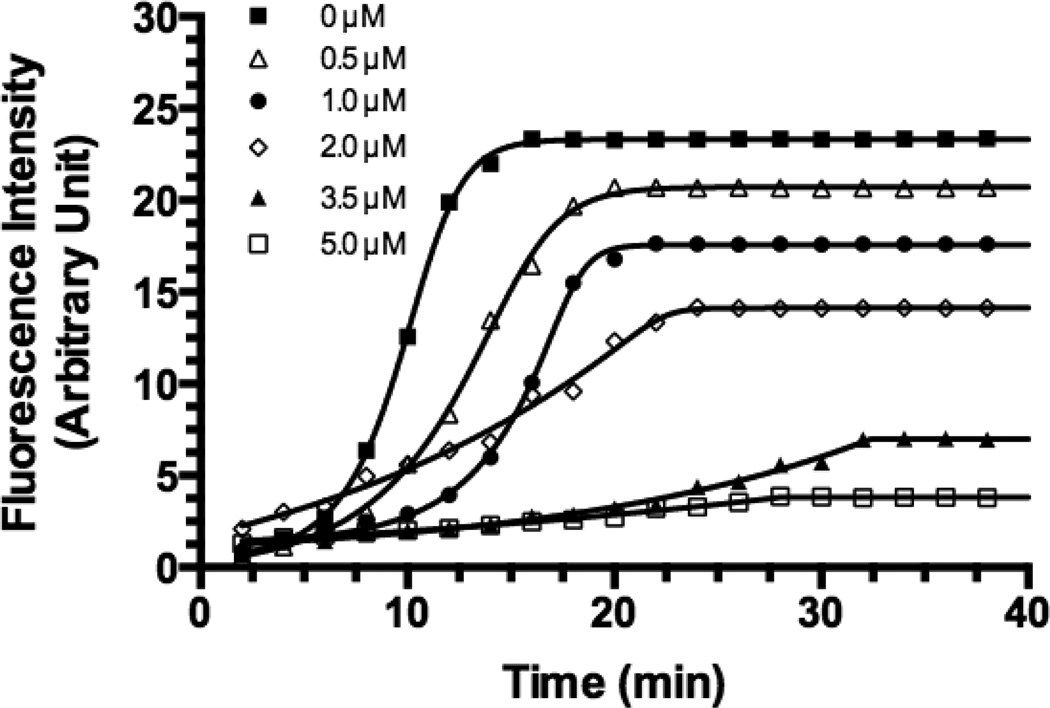
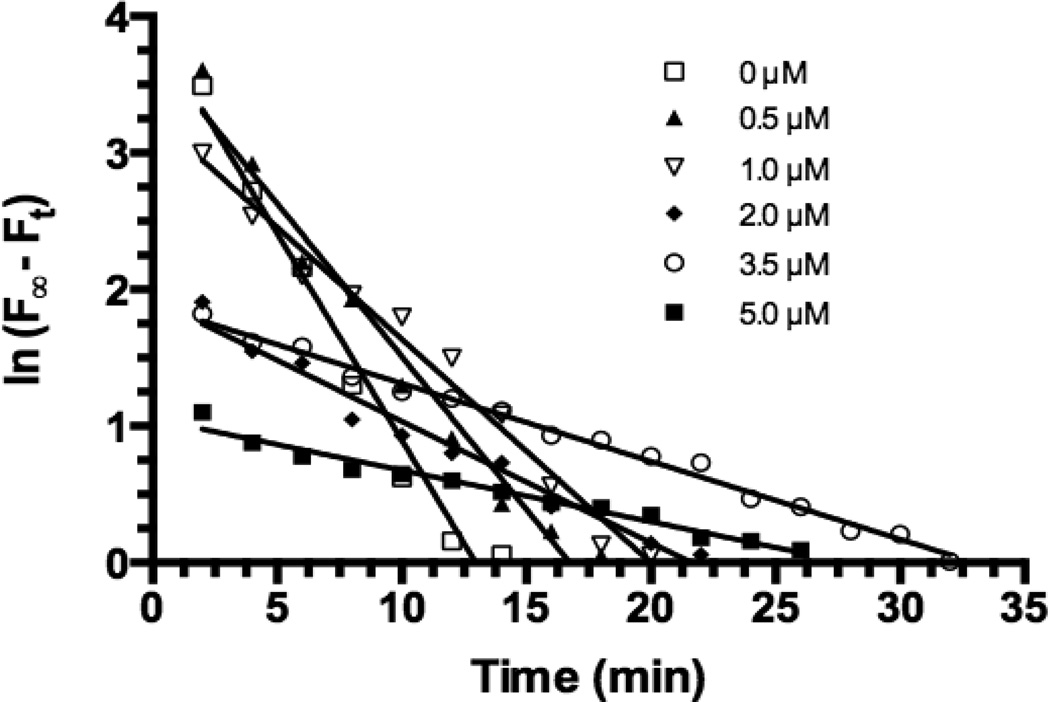
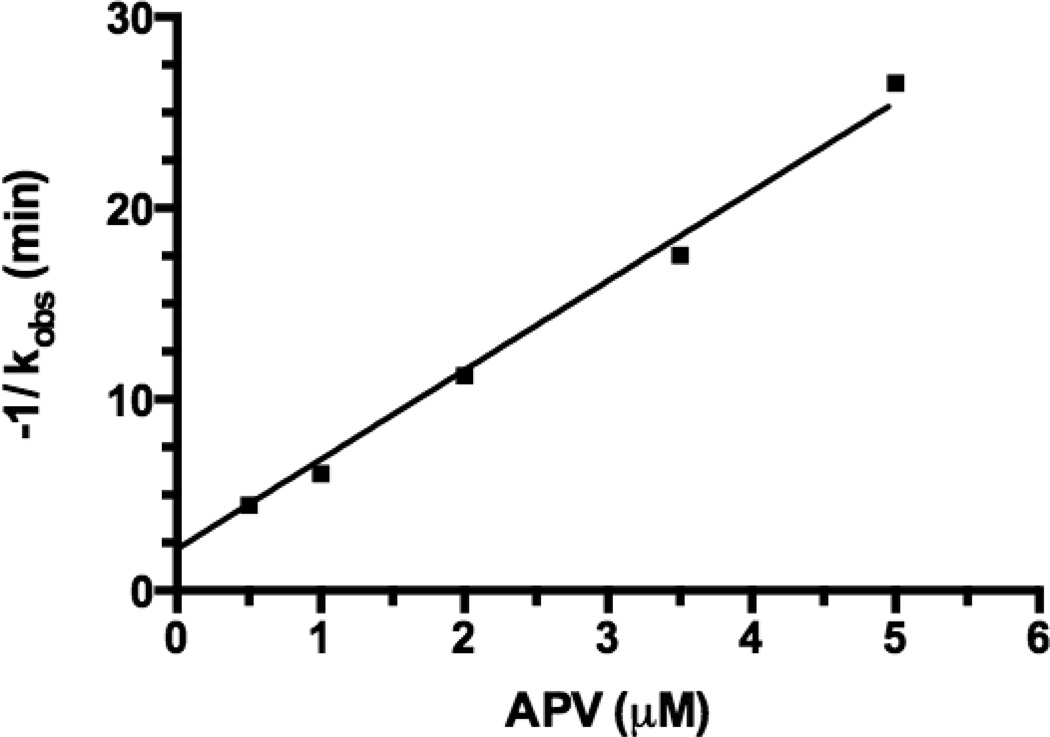
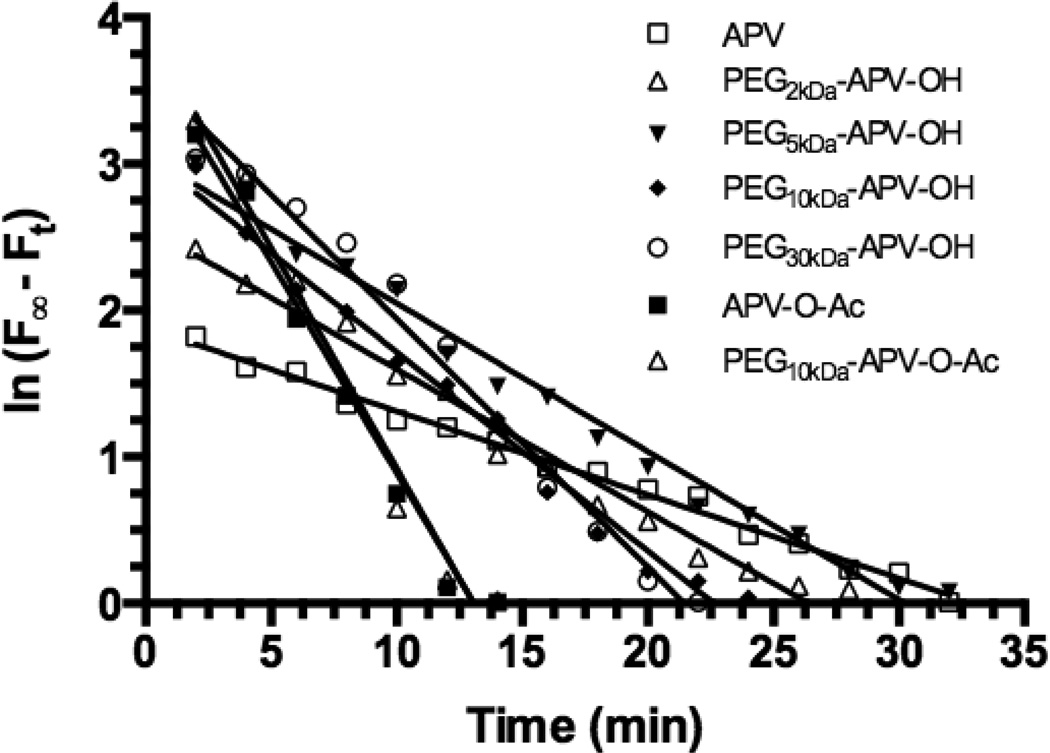
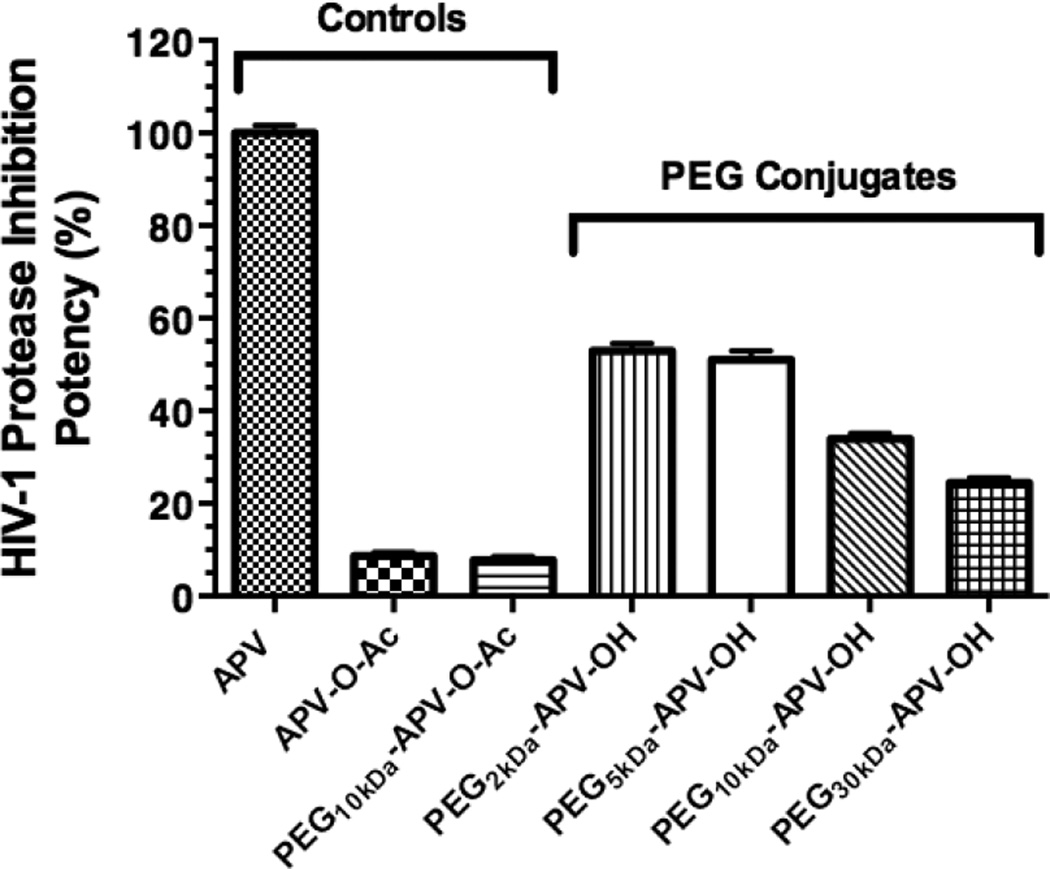
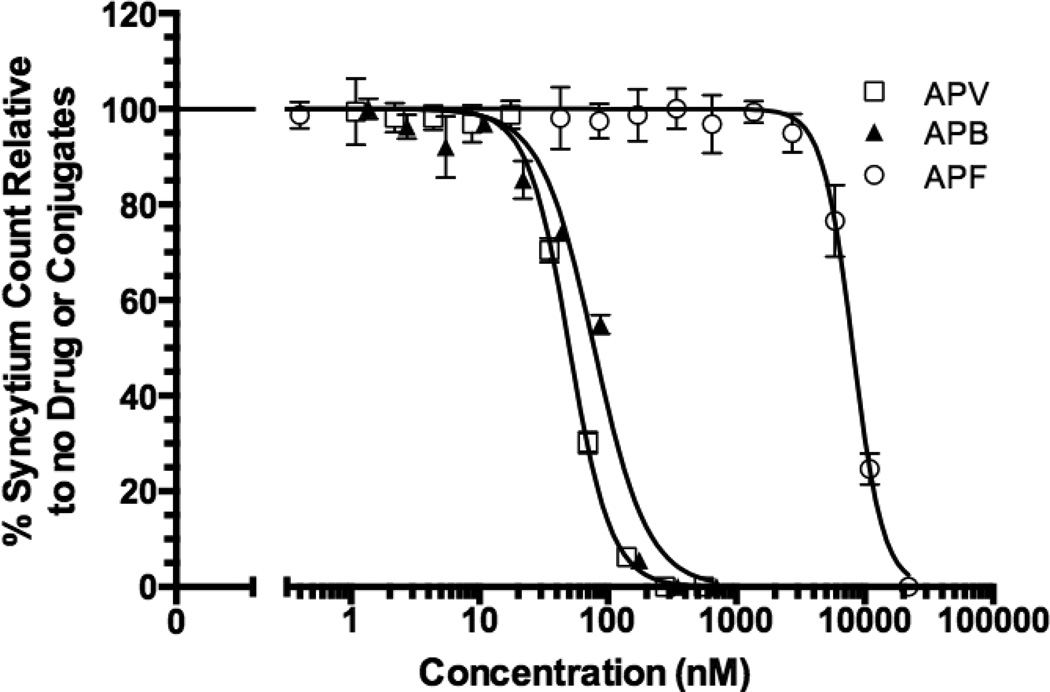
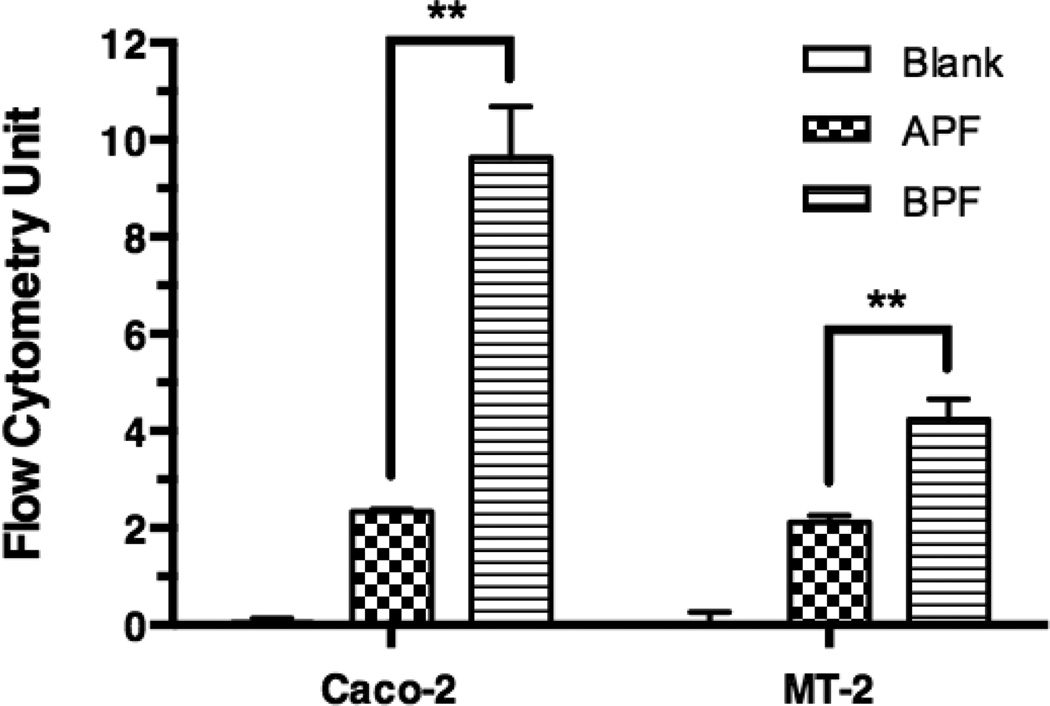
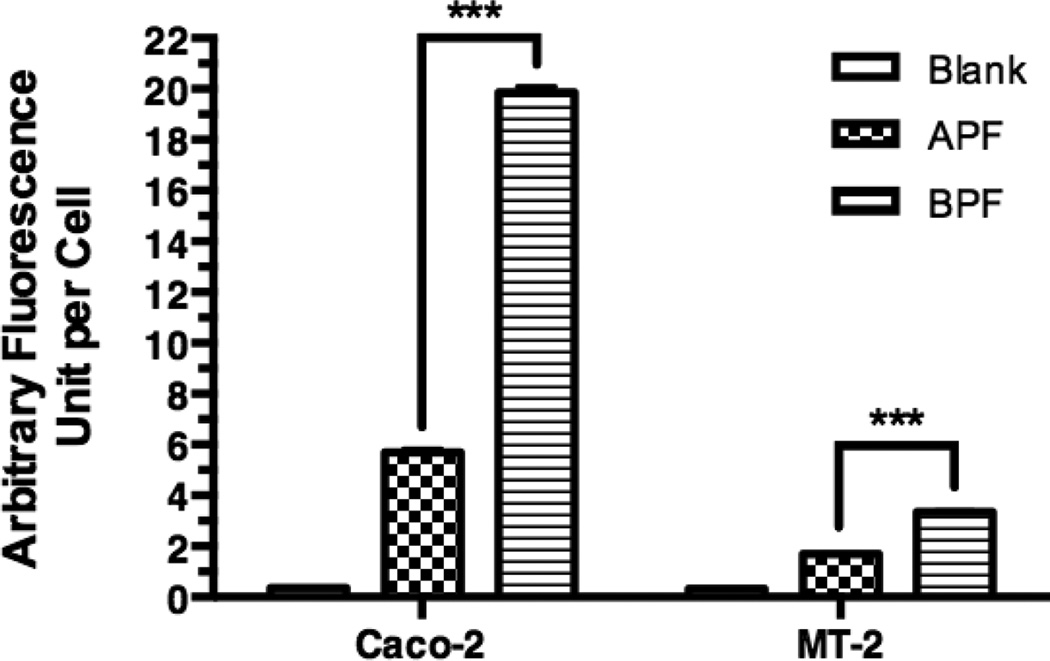
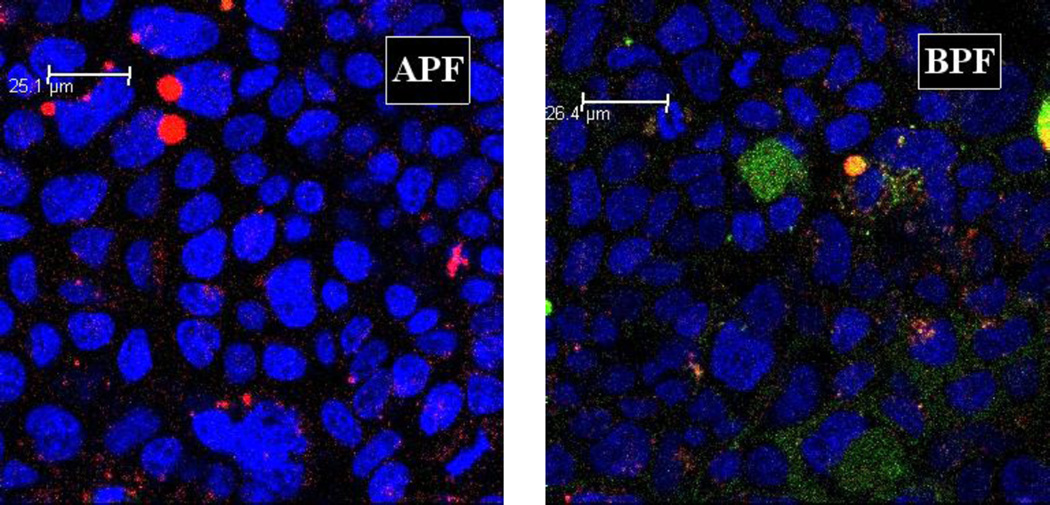
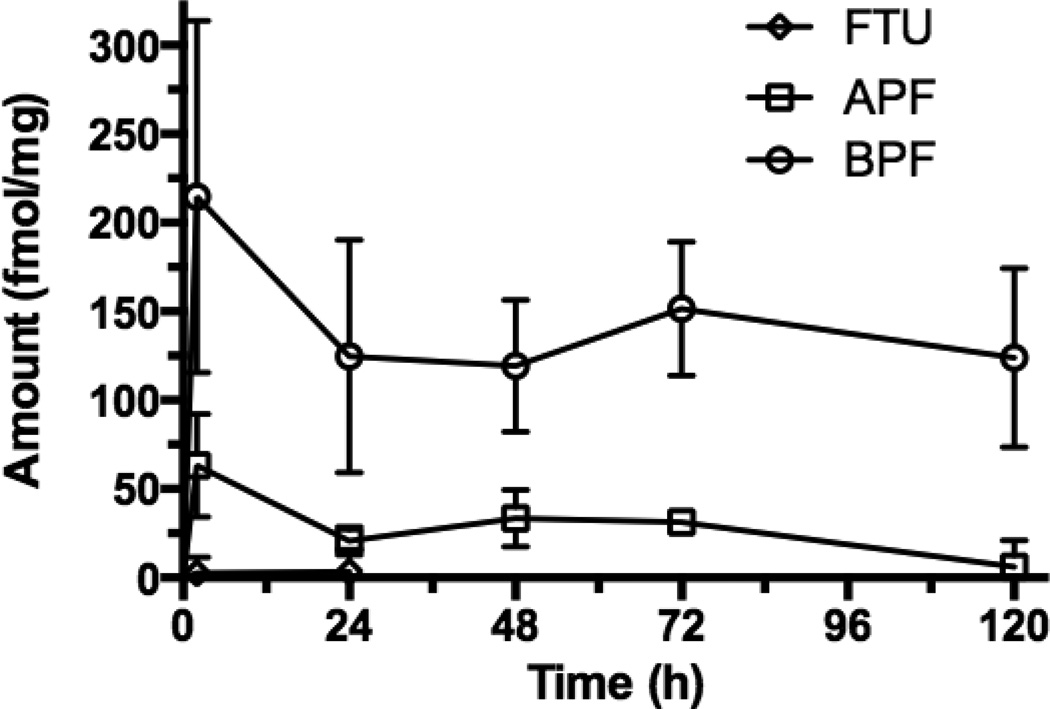
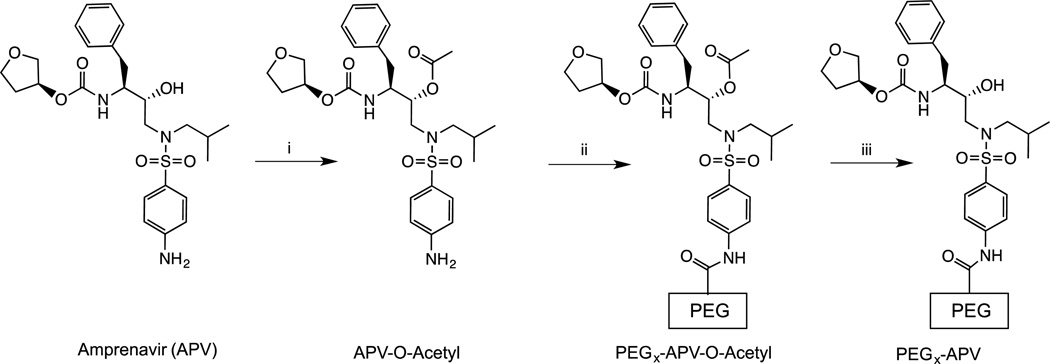
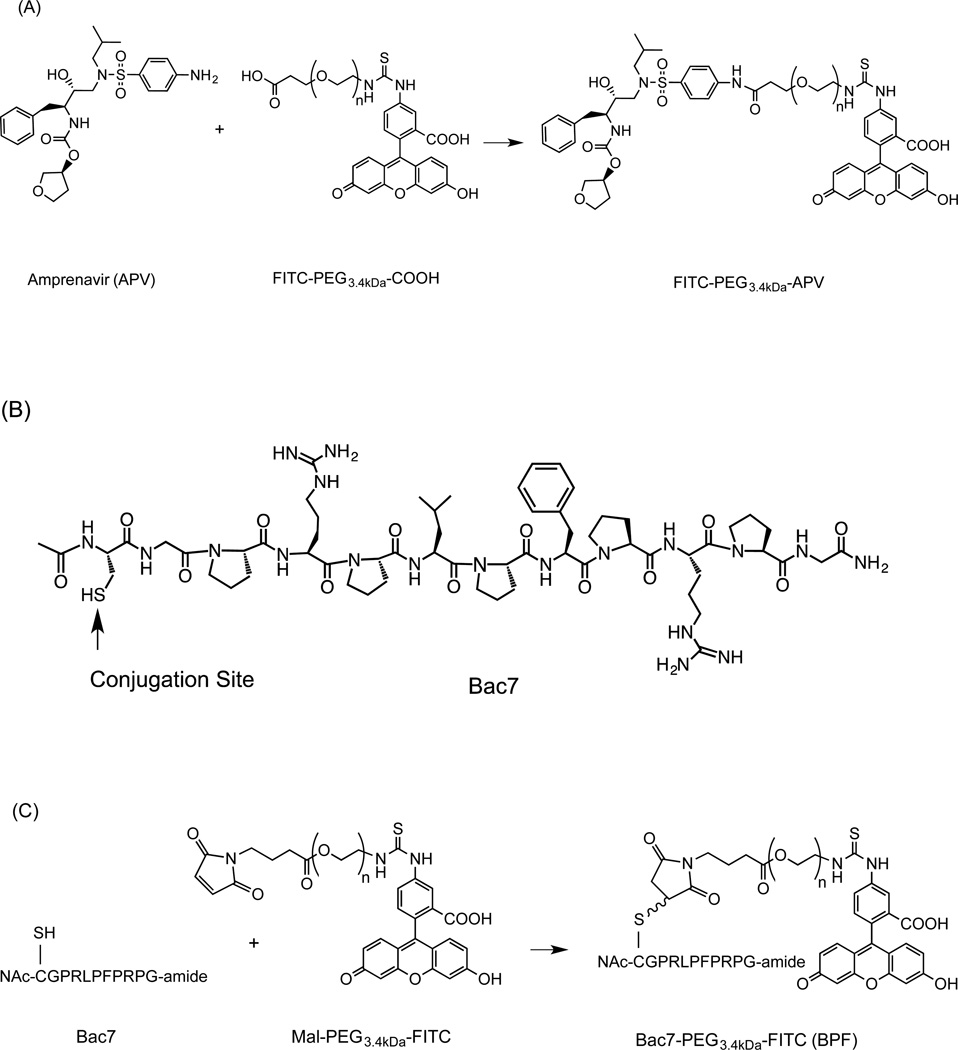
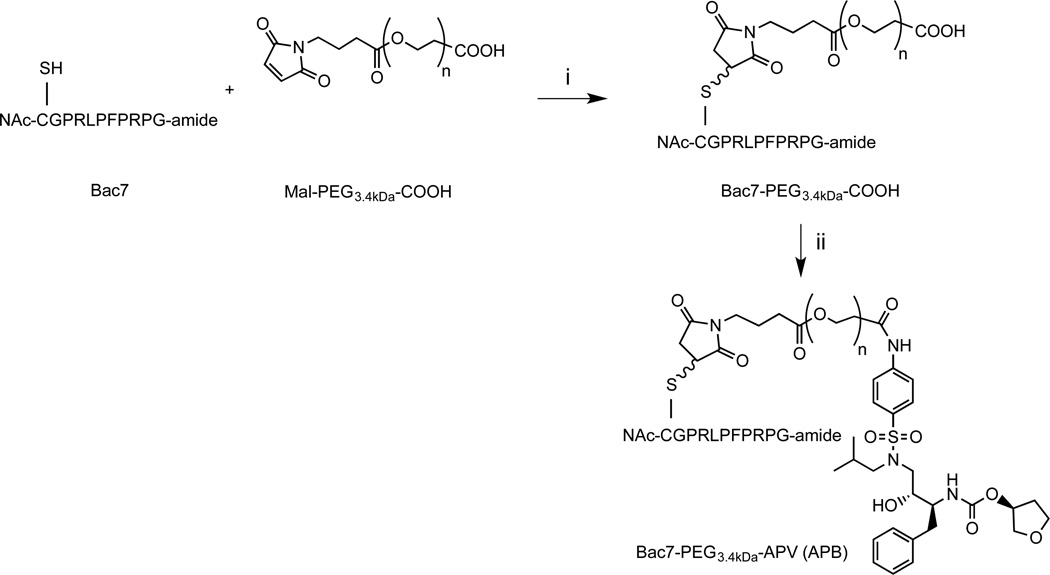
Local delivery of anti-HIV drugs to the colorectal mucosa, a major site of HIV replication, and their retention within mucosal tissue would allow for a reduction in dose administered, reduced dosing frequency and minimal systemic exposure. The current report describes a mucosal pre-exposure prophylaxis (mPrEP) strategy that utilizes nanocarrier conjugates (NC) consisting of poly(ethylene glycol) (PEG), amprenavir (APV), and a cell-penetrating peptide (CPP; namely Bac7, a fragment derived from bactenecin 7). APV-PEG NCs with linear PEGs (2, 5, 10, and 30 kDa) exhibited reduced (52-21%) anti-HIV-1 protease (PR) activity as compared to free APV in an enzyme-based FRET assay. In MT-2 T cells, APV-PEG3.4 kDa-FITC (APF) anti-HIV-1 activity was significantly reduced (160-fold, IC50 = 8064 nM) due to poor cell uptake, whereas it was restored (IC50 = 78.29 nM) and similar to APV (IC50 = 50.29 nM) with the addition of Bac7 to the NC (i.e., APV-PEG3.4 kDa-Bac7, APB). Flow cytometry and confocal microscopy demonstrated Bac7-PEG3.4 kDa-FITC (BPF) uptake was two- and fourfold higher than APF in MT-2 T cells and Caco-2 intestinal epithelial cells, respectively. There was no detectable punctate fluorescence in either cell line suggesting that BPF directly enters the cytosol thus avoiding endosomal entrapment. After colorectal administration in mice, BPF mucosal concentrations were 21-fold higher than APF concentrations. BPF concentrations also remained constant for the 5 days of the study suggesting that (1) the NC's structural characteristics (i.e., the size of the PEG carrier and the presence of a CPP) significantly influenced tissue persistence, and (2) the NCs were probably lodged in the lamina propria since the average rodent colon mucosal cell turnover time is 2-3 days. These encouraging results suggest that Bac7 functionalized NCs delivered locally to the colorectal mucosa may form drug delivery depots that are capable of sustaining colorectal drug concentrations. Although the exact mechanisms for tissue persistence are unclear and will require further study, these results provide proof-of-concept feasibility for mPrEP.

Keywords: Amprenavir; Bactenecin 7; Cell penetrating peptide; Darunavir; HIV; Mucosal delivery; PEG conjugation; Polymeric drug delivery systems; Pre-exposure prophylaxis.


Figures

Figure 1
Figure 1. Cleavage kinetics of HIV-1 PR FRET peptide substrate (5.0µM) by recombinant HIV-1 PR (35.2 nM) at 37 °C in the assay buffer in the presence of different APV concentrations (0–5.0 µM)
All measurements were performed in triplicate and reported as mean ± SD (n = 3). The effect of APV 3.5 µM and 5.0 µM was not significantly different (p>0.05).
Figure 2
Figure 2. Plots of ln(F, -Ft) vs. time for APV (0–5 µM). The plots were prepared using the data obtained from Figure 1
F is the maximum fluorescence intensity (0 µM of APV) and Ft is fluorescence intensity at time t (min). Linear regression analysis yielded straight lines (R2 >0.9711) and the slope of each line yields the rate constant (kobs, min−1). kobs values: −0.3027 (± 0.02341) for 0 µM, −0.2239 (± 0.01459) for 0.5 µM, −0.1638 (± 0.007995) for 1.0 µM, −0.0890 (± 0.004938) for 2.0 µM, −0.05704 (± 0.00144) for 3.5 µM, and −0.03766 (± 0.00191) for 5.0 µM.
Figure 3
Figure 3. Plot of negative reciprocal of observed rate constant (−1/kobs) vs. APV concentrations
The −1/kobs value increased with APV concentration in a linear manner (R2 = 0.9858), which reflects the anti-HIV-1 PR activity of APV or an APV-PEG NC. This figure was used to derive the apparent APV concentration (APVapp) values for APV and each APV-PEG NC, all at 3.5 µM. The APVapp value was used as an indicator of anti-HIV-1 PR potency to compare APV with different APV-NCs (cf. Table 1).
Figure 4
Figure 4. Plots of ln (FFt) vs. time for APV, PEG-APV NCs and the two negative controls, all at 3.5 µM APV-equivalent concentrations
Linear regression analysis yielded straight lines (R2 ≥0.9655) and the slope of each line yields the rate constant (kobs, min−1). The kobs values are: −0.05704 (± 0.001439) for APV, −0.09743 (± 0.004131) for PEG2kDa-APV-OH, −0.1011 (± 0.003616) for PEG5kDa-APV-OH, −0.1358 (± 0.005545) for PEG10kDa-APV-OH, −0.1695 (± 0.008027) for PEG30kDa-APV-OH, −0.2886 (± 0.01815) for APV-O-Ac, and −0.3013 (± 0.02051) for PEG10kDa-APV-O-Ac. The kobs values were converted to [−1/(kobs ± s.d.)] that were fitted into the linear regression equation derived from Fig. 3 to yield the apparent APV concentration (APVapp) values for APV and APV-PEG NCs. APVapp values (µM): 3.288 (± 0.095) for APV, 1.737 (± 0.093) for PEG2kDa-APV-OH, 1.678 (± 0.109) for PEG5kDa-APV-OH, 1.117 (± 0.064) for PEG10kDa-APV-OH, 0.804 (± 0.060) for PEG30kDa-APV-OH, 0.285 (± 0.047) for APV-O-Ac, and 0.254 (± 0.049) for PEG10kDa-APV-O-Ac.
Figure 5
Figure 5. Effect of PEG size on the HIV-1 PR inhibition potency of APV-PEG NCs
All NCs were tested at APV-equivalent concentration of 3.5 µM. The potencies expressed as the apparent APV concentrations (APVapp) derived from Fig. 3 and 4 were referenced to the potency of APV (the APV reference being 100% potent). One-way ANOVA analysis followed by Tukey multiple comparison test were performed. Except for the comparison between PEG2kDa-APV-OH and PEG5kDa-APV-OH and between the two negative controls (APV-O-Ac and PEG10kDa-APV-O-Ac) (p>0.05), all other pair-wise comparisons were highly statistically different (p<0.01). Specifically, each NC’s potency differed from that of either the positive control or either one of the two negative controls (p<0.01) and the potency of PEG2kDa-APV-OH/PEG5kDa-APV-OH differed from either that of PEG10kDa-APV-OH or that of PEG30kDa-APV-OH (p<0.01).
Figure 6
Figure 6. Anti-HIV-1 activity of APV-PEG3.4kDa-Bac7 CPP (APB), APV-PEG3 4kDa-FITC (APF) and free APV
The anti-HIV-1 activity was determined by the inhibition of syncytium formation in HIV-1 infected MT-2 T-cells and expressed as % of syncytium count of no treatment. Non-linear curve-fitting using the dose-response equation was used to determine the IC50 values. The R2 values of the curve fitting are 0.9672 for APV, 0.9067 for APF and 0.9511 for APB. APF activity (IC50 = 8064 nM) was significantly lower than APV (IC50 = 50.29 nM) (p<0.001). Further conjugation with Bac7 CPP (i.e., the APB NC, IC50 = 78.29 nM) almost completely restored APV activity with no significant difference in IC50 values (p>0.05). Data are reported as mean ± SD of three independent experiments.
Figure 7
Figure 7. Total cell-associated fluorescence levels of NCs in Caco-2 and MT-2 cells as measured by flow cytometry
Caco-2 cells and MT2 cells were incubated with medium (Blank), 10 µM of APF, or 10 µM BPF for 2 h and washed before flow cytometry. The total cell-associated fluorescence levels are mean ± s.d. of at least of two independent experiments. One-way ANOVA analysis followed by Tukey multiple comparison test were performed. The symbol “**” indicates that the fluorescence level of BPF in both cell types was significantly higher than that of APF (p < 0.01).
Figure 8
Figure 8. Intracellular levels of NCs in Caco-2 cells and MT-2 T-cells as measured by confocal microscopy
Caco-2 cells and MT-2 cells were incubated with medium (Blank), 10 µM of APF, or 10 µM BPF for 4 h and washed before confocal microscopy. A 40 × objective was used for the acquisition of Z-stack of images in the XYZ mode for each treatment. Quantification of intracellular fluorescence levels used LAS AF Lite (Leica Software) on non-edited entire stacks of images (sections) that contained more than 500 cells per stack. Each value is the mean ± s.d. of fluorescence of an entire stack of 13 to 17 sections. One-way ANOVA analysis followed by Tukey multiple comparison test were performed. The symbol *** indicates that the fluorescence level of BPF in both cell types was significantly higher than that of APF (p < 0.0001).
Figure 9
Figure 9. Confocal microscopic images of Caco-2 cells incubated with APF (left) or BPF (right) at 2.47 × magnification
Caco-2 cells three days after confluence were treated as described in Fig. 8. A middle section in a stack is shown. Each image was merged from three separate blue, green and red images of the same field. Two features are clear. The first is the sharp contrast between lack of green intracellular fluorescence in APF-treated cells (APF) and significant green intracellular fluorescence in BPF-treated cells (BPF). The second one is lack of co-localization of green and red fluorescence in the BPF image, indicating that most intracellular green fluorescence was located in the cytosol/nucleus compartment. Note in the APF image there are a few blobs of red fluorescence at the upper-left corner that are likely to be artifacts of cell debris.
Figure 10
Figure 10. Retention of PEG-conjugated and Bac7 CPP-conjugated BPF in mouse colorectal mucosa
Mice treated with 200 µl enema containing 30 µM FTU, APF or BPF for 2h. Colorectal mucosa tissue was scrapped, homogenized, spun and the fluorescence of the supernatant was quantified, converted to fmole, normalized by mucosa tissue weight. Tissue retention was examined for up to 5 days, BPF is greater than APF at all time points (One way ANOVA p < 0.05, n = 4).
Scheme 1
Scheme 1
Synthesis of PEGx-APV-O-acetyl and PEGx-APV-OH nanocarrier conjugates. Reagents and conditions: (i) DMF, DIPEA, acetic anhydride, room temperature, 12 h; (ii) DMF, DIPEA, mPEGx-NHS (x = 2, 5, 10, 30 kDa), room temperature, 24 h; and (iii) 0.1 N HCl, neutralized with NaHCO3.
Scheme 2
Scheme 2
Synthesis of fluorescein-labeled APV-PEG (APF) and Bac7 CPP-PEG NCs (BPF): (A) APV-PEG3.4kDa-FITC; (B) Structure of Bac7 analog; and (C) Bac7 CPP-PEG3.4kDa-FITC. Reagents and conditions: (i) DMF containing EDCI and HOAt, room temperature, 16 h; and (ii) DMF, room temperature, 4 h. PEG-fluorescein is linked to APV via an amide bond and to Bac7 via a thioether bond.
Scheme 3
Scheme 3
Synthesis of APV-PEG3.4kDa-Bac7 CPP (APB). The cell penetrating peptide, Bac7, was linked to maleimide-PEG3.4kDa-COOH via a thioether bond. APV was linked to Bac7 CPP-PEG3.4kDa-COOH via an amide bond. Reagents and conditions: (i) DMF, room temperature, 4 h. (ii) DMF containing WSC and HOAt, room temperature, 16 h.
Scheme 4
Scheme 4
FRET-based PR activity inhibition assay. Fluorescence of EDANS fluorophore is quenched by distance-dependent fluorescence resonance energy transfer (FRET) to the DABCYL quencher group, which results in an increase in fluorescence signal. In the presence of an inhibitor such as APV the cleavage of the fluorescent substrate by PR is inhibited in a dose-dependent manner, which is observed as a decrease in fluorescence intensity.

Similar articles

Cited by

References

    1. Sheet WAF. [Accessed July 28 2015];Fact sheet N°360. 2015 WHO, http://www.who.int/mediacentre/factsheets/fs360/en/. http://www.who.int/mediacentre/factsheets/fs360/en/
    1. Mutua G, Sanders E, Mugo P, Anzala O, Haberer JE, Bangsberg D, et al. Safety and adherence to intermittent pre-exposure prophylaxis (PrEP) for HIV-1 in African men who have sex with men and female sex workers. PloS one. 2012;7(4) - PMC - PubMed
    1. Karim QA, Karim SSA, Frohlich JA, Grobler AC, Baxter C, Mansoor LE, et al. Effectiveness and safety of tenofovir gel, an antiretroviral microbicide, for the prevention of HIV infection in women. Science. 2010;329(5996):1168–1174. - PMC - PubMed
    1. Thigpen MC, Kebaabetswe PM, Paxton LA, Smith DK, Rose CE, Segolodi TM, et al. Antiretroviral preexposure prophylaxis for heterosexual HIV transmission in Botswana. The New England journal of medicine. 2012;367(5):423–434. - PubMed
    1. Baeten JM, Donnell D, Ndase P, Mugo NR, Campbell JD, Wangisi J, et al. Antiretroviral prophylaxis for HIV prevention in heterosexual men and women. The New England journal of medicine. 2012;367(5):399–410. - PMC - PubMed

Publication types

MeSH terms