

Regulation of alternative splicing at the single-cell level
- PMID: 26712315
- PMCID: PMC4704489
- DOI: 10.15252/msb.20156278
Regulation of alternative splicing at the single-cell level
Abstract
Alternative splicing is a key cellular mechanism for generating distinct isoforms, whose relative abundances regulate critical cellular processes. It is therefore essential that inclusion levels of alternative exons be tightly regulated. However, how the precision of inclusion levels among individual cells is governed is poorly understood. Using single-cell gene expression, we show that the precision of inclusion levels of alternative exons is determined by the degree of evolutionary conservation at their flanking intronic regions. Moreover, the inclusion levels of alternative exons, as well as the expression levels of the transcripts harboring them, also contribute to this precision. We further show that alternative exons whose inclusion levels are considerably changed during stem cell differentiation are also subject to this regulation. Our results imply that alternative splicing is coordinately regulated to achieve accuracy in relative isoform abundances and that such accuracy may be important in determining cell fate.
Keywords: alternative splicing; evolutionary conservation; inclusion level; single cell; splicing regulation.
© 2015 The Authors. Published under the terms of the CC BY 4.0 license.
Figures
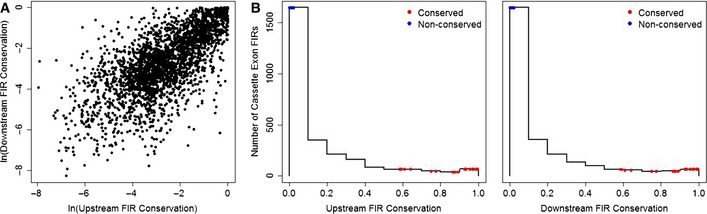
Evolutionary conservations at upstream and downstream
FIR s are strongly correlated (Spearman's correlation coefficient = 0.69; P < 10−16). Each point represents the average of up to 200‐bp position‐specific evolutionary conservation scores at upstream and downstreamFIR s of the 2,731 cassette exons in our data (Table EV1).Histograms of the evolutionary conservation scores at upstream (left panel) and downstream (right panel)
FIR s display a right‐skewed distribution.FIR conservations of the 22 conserved and 22 non‐conserved cassette exons selected for the single‐cellRT –qPCR assay are denoted by red and blue points, respectively.
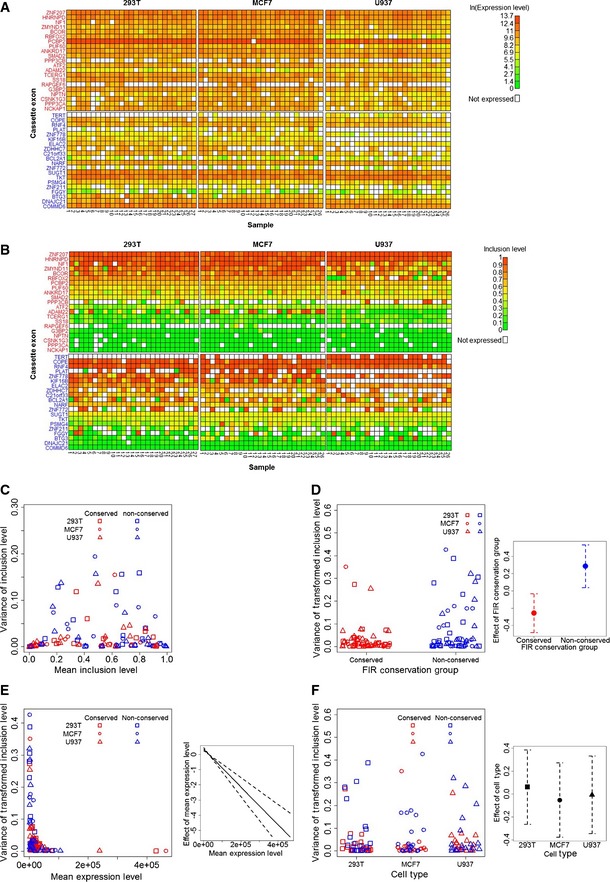
Heat maps of the expression levels (in ln(Et) units) of included and skipped isoforms of the cassette exons. Gene names of the conserved (red) and non‐conserved (blue) cassette exons are in rows, and single‐cell samples of each of the three cell types are in columns.
Heat maps of the estimated inclusion levels of the cassette exons.
Dependence of the variance of the cassette exon inclusion levels (y‐axis) on their mean inclusion levels (x‐axis) in the RT‐qPCR data. Each point represents a cassette exon. This dependence resembles the dependence expected under the assumption that inclusion or exclusion of a cassette exon is a Bernoulli experiment (Appendix Fig S1).
FIR conservation increases the precision of inclusion levels. The left panel shows the variance of the transformed inclusion levels as a function of the cassette exon
FIR conservation group. The right panel shows the effects (red and blue points) of the twoFIR conservation groups on the variance of their inclusion levels as determined by theGLMM analysis along with their standard errors (dashed lines).High expression levels of the included and skipped transcripts increase the precision of their inclusion levels. The left panel shows the variance of the transformed inclusion levels as a function of the cassette exon expression levels. The right panel shows the effect (solid line) of expression level on the variance of inclusion levels as determined by the
GLMM analysis, along with their standard errors (dashed lines).Precision of inclusion levels is independent of cell type. The left panel shows the variance of the transformed inclusion levels as a function of cell type. The right panel shows the effects (points) of the three cell types on the variance of inclusion levels as determined by the
GLMM analysis, along with their standard errors (dashed lines).
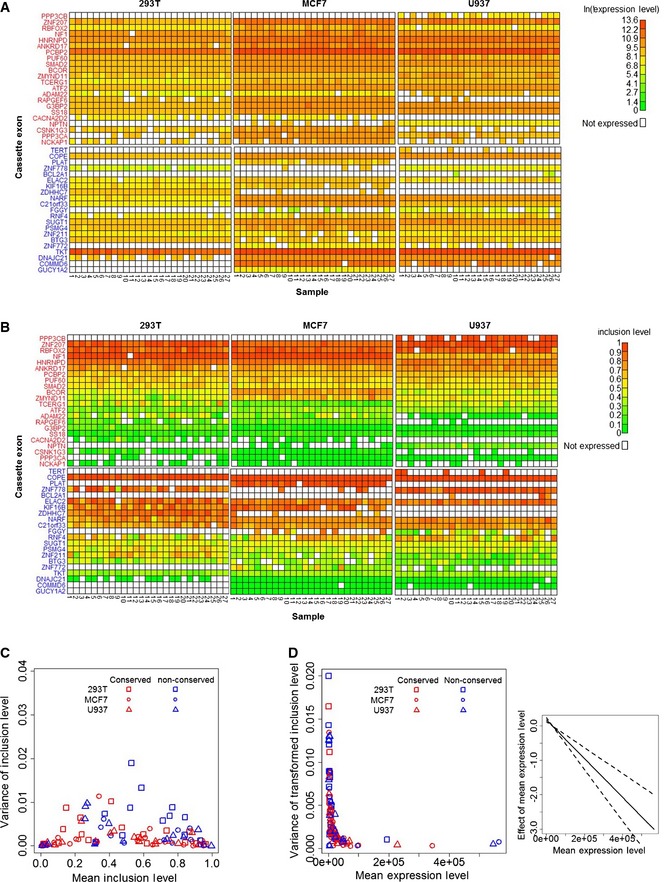
Heat maps of the expression levels (in ln(Et) units) of included and skipped isoforms of the cassette exons. Gene names of the conserved (red) and non‐conserved (blue) cassette exons are in rows, and bulk
RNA samples of each of the three cell types are in columns.Heat maps of the estimated inclusion levels of the cassette exons.
Dependence of the variance of the cassette exon inclusion levels (y‐axis) on their mean inclusion levels (x‐axis) in the bulk
RNA RT –qPCR data. This dependence resembles the expected dependence under the assumption that inclusion or exclusion of a cassette exon is a Bernoulli experiment (Appendix Fig S1).High expression levels of the included and skipped isoforms increase the precision of their inclusion levels. The left panel shows the variance of the transformed inclusion levels as a function of the cassette exon expression levels. The right panel shows the effect (solid line) of expression level on the variance of inclusion levels as determined by the
GLMM analysis, along with its standard error (dashed lines).
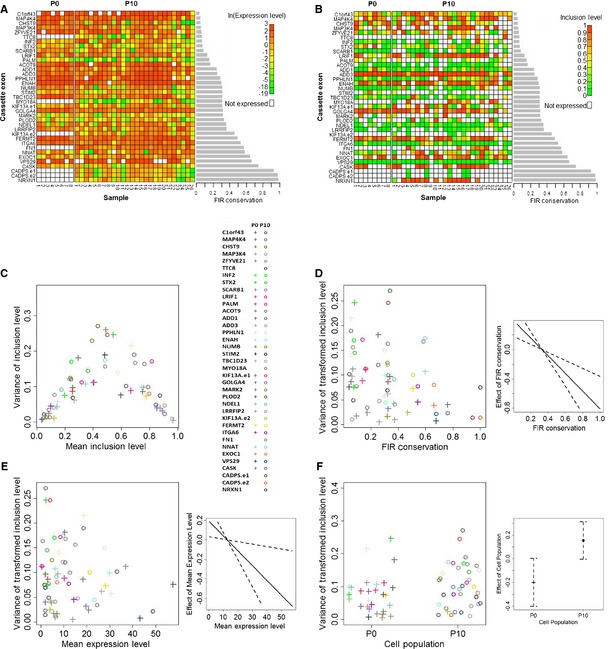
Heat maps of the expression levels (in ln(FPKM) units) of the genes harboring the differentiation‐switched cassette exons. Gene names of the differentiation‐switched cassette exons are in rows (the
CADPS andKIF 13A genes harbor two differentiation‐switched cassette exons which are labeledCADPS .e1 andCADPS .e2 andKIF 13A.e1 andKIF 13A.e2), and single‐cell samples of each of the two cell populations are in columns.Heat maps of the estimated inclusion levels of the differentiation‐switched cassette exons.
Dependence of the variance of differentiation‐switched cassette exon inclusion levels (y‐axis) on their mean inclusion levels (x‐axis). The color code for each cassette exon is given in the right panel. This dependence resembles the expected dependence under the assumption that inclusion or exclusion of a cassette exon is a Bernoulli experiment (Appendix Fig S1).
FIR conservation increases the precision of inclusion levels. The left panel shows the variance of the transformed inclusion levels as a function of the differentiation‐switched cassette exon
FIR conservation. The right panel shows the effect (solid line) ofFIR conservation of differentiation‐switched cassette exons on the variance of their inclusion levels as determined by theGLMM analysis along with their standard errors (dashed lines).High expression levels of transcripts harboring the differentiation‐switched cassette exons increase the precision of their inclusion levels. The left panel shows the variance of the transformed inclusion levels as a function of the differentiation‐switched cassette exon expression levels. The right panel shows the effect (solid line) of expression level on the variance of inclusion levels as determined by the
GLMM analysis, along with their standard errors (dashed lines).Cell population has a negligible effect on the precision of inclusion levels. The left panel shows the variance of the transformed inclusion levels as a function of the cell population. The right panel shows the effects (points) of the two cell populations on the variance of inclusion levels as determined by the
GLMM analysis, along with their standard errors (dashed lines).
References
-
- Barash Y, Calarco JA, Gao W, Pan Q, Wang X, Shai O, Blencowe BJ, Frey BJ (2010) Deciphering the splicing code. Nature 465: 53–59 - PubMed
-
- Benjamini Y, Hochberg Y (1995) Controlling the false discovery rate: a practical and powerful approach to multiple testing. J R Stat Soc Ser B 57: 289–300
-
- Boucard AA, Chubykin AA, Comoletti D, Taylor P, Südhof TC (2005) A splice code for trans‐synaptic cell adhesion mediated by binding of neuroligin 1 to α‐ and β‐neurexins. Neuron 48: 229–236 - PubMed
MeSH terms
Substances
Associated data
- Actions
LinkOut - more resources
Full Text Sources
Other Literature Sources
