

Mechanistic Population Pharmacokinetics of Morphine in Neonates With Abstinence Syndrome After Oral Administration of Diluted Tincture of Opium
- PMID: 26712409
- PMCID: PMC4927406
- DOI: 10.1002/jcph.696
Mechanistic Population Pharmacokinetics of Morphine in Neonates With Abstinence Syndrome After Oral Administration of Diluted Tincture of Opium
Abstract
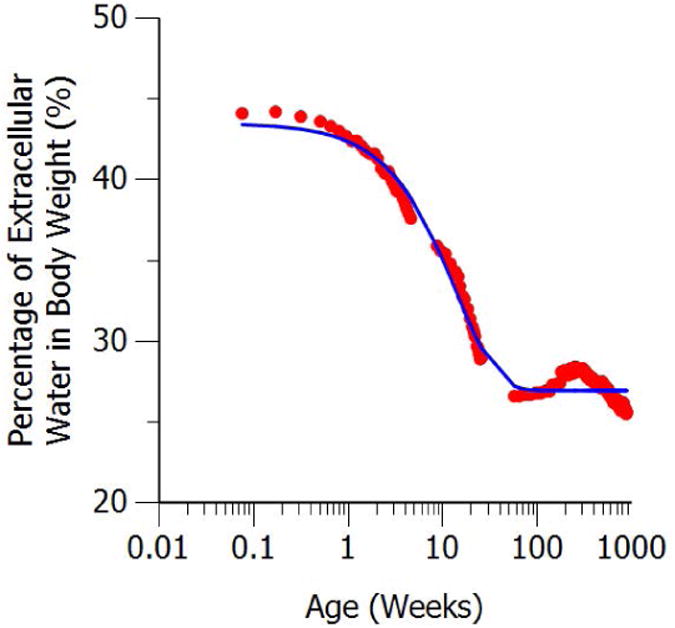
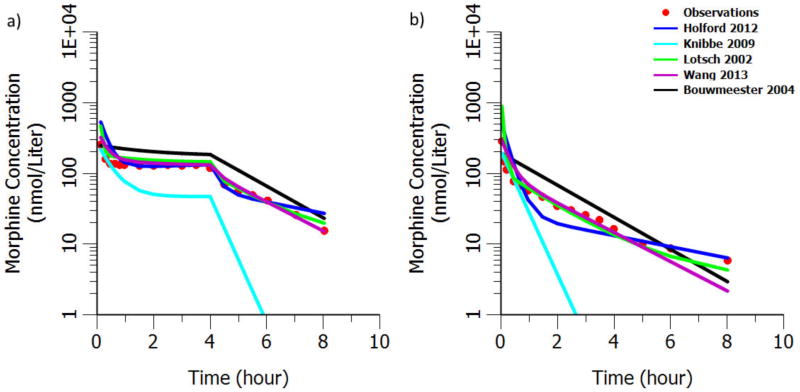
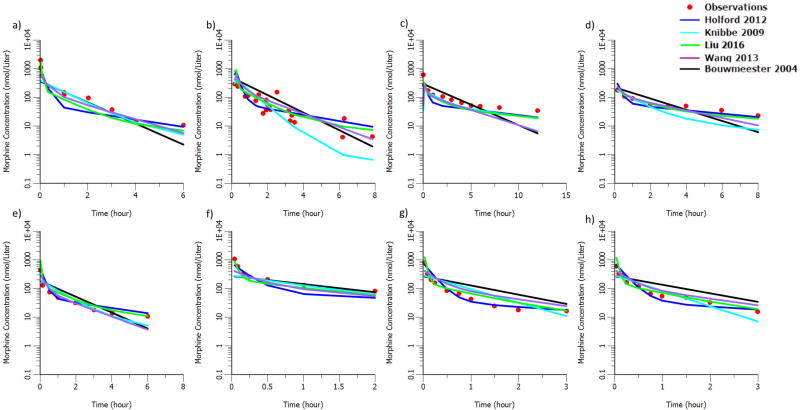
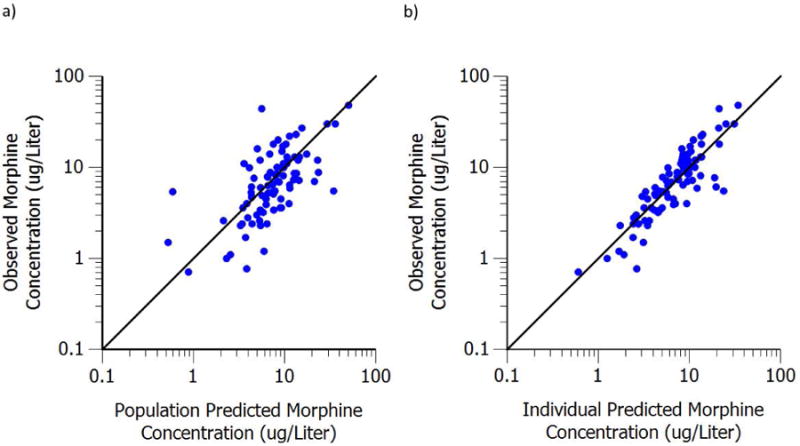
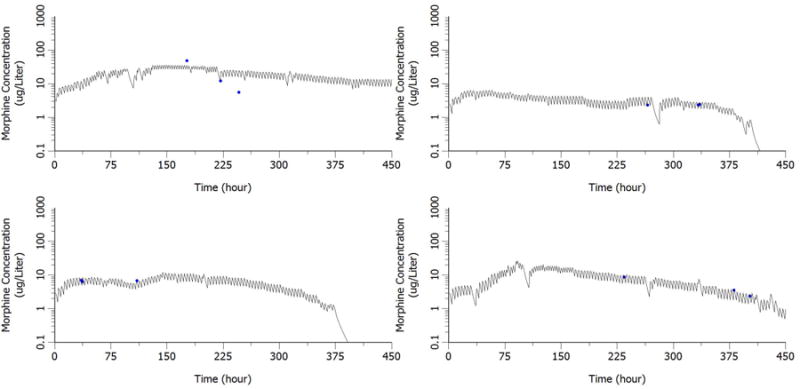
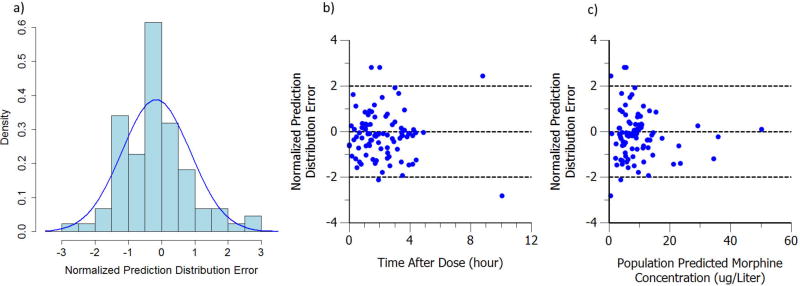
Conducting and analyzing clinical trials in vulnerable neonates are extremely challenging. The aim of this analysis is to develop a morphine population pharmacokinetics (PK) model using data collected during a randomized control trial in neonates with abstinence syndrome (NAS). A 3-compartment morphine structural PK model after intravenous (IV) administration from previously published work was utilized as prior, whereas an allometric scaling method with physiological consideration was used to extrapolate a PK profile from adults to pediatrics. The absorption rate constant and bioavailability were estimated in NAS after oral administration of diluted tincture of opium (DTO). Goodness-of-fit plots along with normalized prediction distribution error and bootstrap method were performed for model evaluation. We successfully extrapolated the PK profile from adults to pediatrics after IV administration. The estimated first-order absorption rate constant and bioavailability were 0.751 hour(-1) and 48.5%, respectively. Model evaluations showed that the model can accurately and precisely describe the observed data. The population pharmacokinetic model we derived for morphine after oral administration of DTO is reasonable and acceptable; therefore, it can be used to describe the PK and guide future studies. The integration of the previous population PK knowledge as prior information successfully overcomes the logistic and practical issue in vulnerable neonate population.
Keywords: bioavailability; diluted tincture of opium; morphine; neonatal abstinence syndrome; neonate; population pharmacokinetic model.
© 2016, The American College of Clinical Pharmacology.
Conflict of interest statement
Figures
References
-
- Finnegan LP, Connaughton JF, Kron RE, Emich JP. Neonatal abstinence syndrome: assessment and management. Addict Dis. 1975;2(1-2):141–58. - PubMed
-
- Kocherlakota P. Neonatal Abstinence Syndrome. Pediatrics. 2014;134(2):e547–e561. - PubMed
-
- Bouwmeester NJ. Developmental pharmacokinetics of morphine and its metabolites in neonates, infants and young children. Br J Anaesth. 2004;92(2):208–217. - PubMed
-
- Holford NHG, Ma SC, Anderson BJ. Prediction of morphine dose in humans. Paediatr Anaesth. 2012;22(3):209–22. - PubMed
Publication types
MeSH terms
Substances
Grants and funding
LinkOut - more resources
Full Text Sources
Other Literature Sources
