. 2016 Jan 7;18(1):67-72.
doi: 10.1016/j.stem.2015.11.017. Epub 2015 Dec 17.

Human-Mouse Chimerism Validates Human Stem Cell Pluripotency

Affiliations

Human-Mouse Chimerism Validates Human Stem Cell Pluripotency

Victoria L Mascetti et al. Cell Stem Cell. .

Abstract

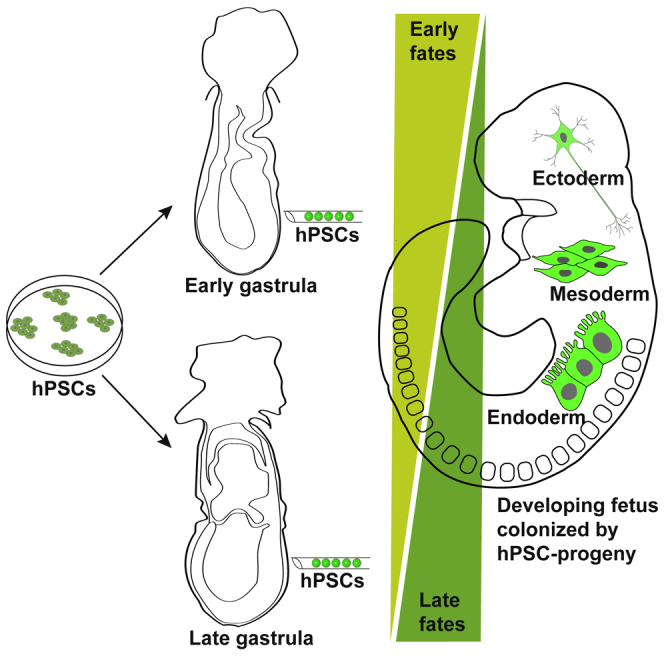
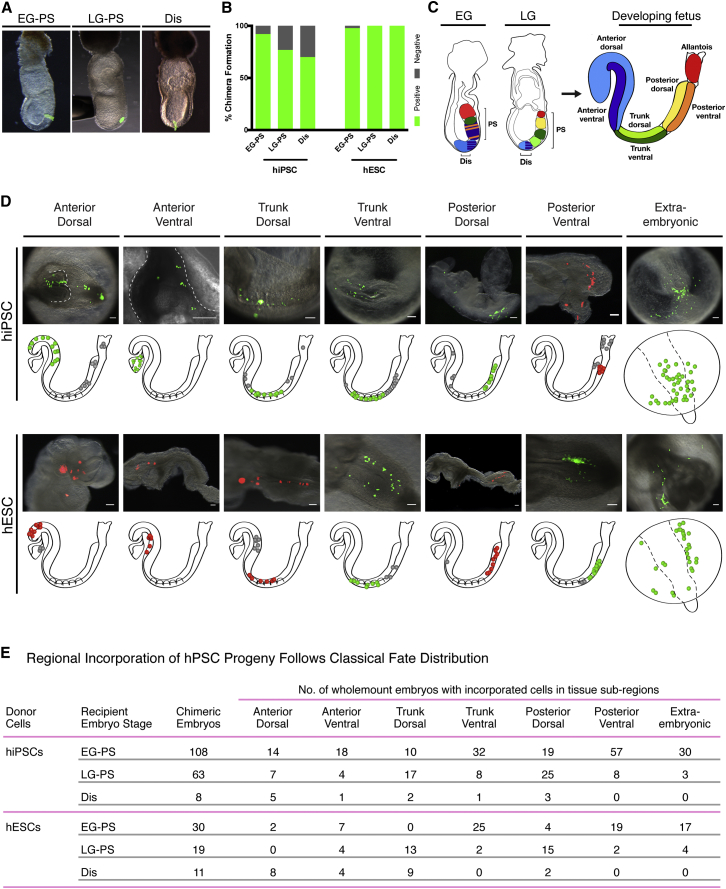
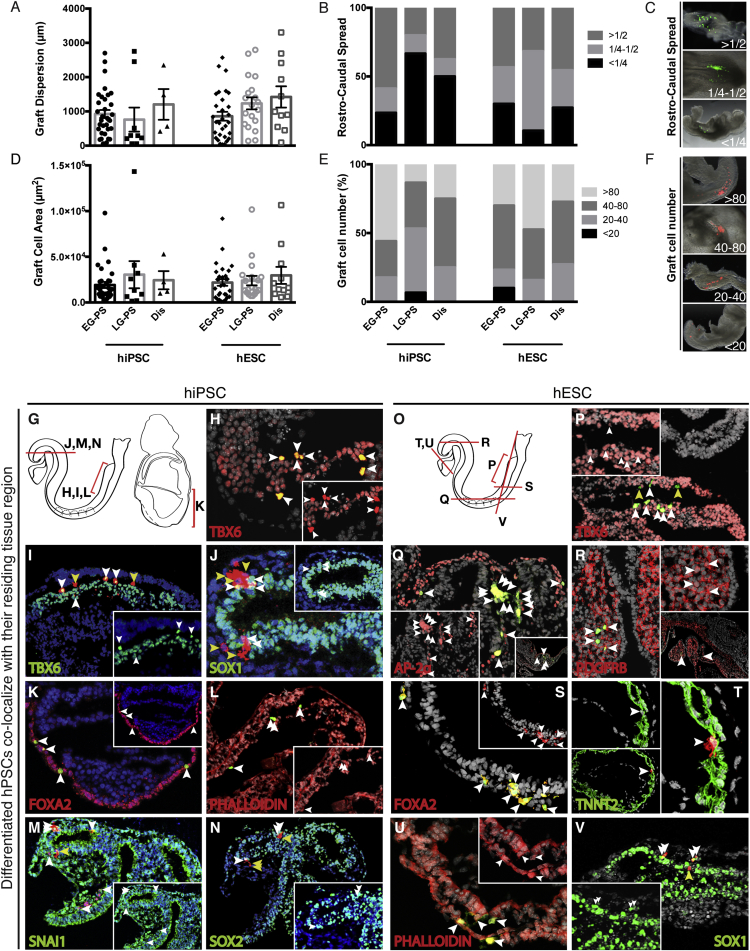
Pluripotent stem cells are defined by their capacity to differentiate into all three tissue layers that comprise the body. Chimera formation, generated by stem cell transplantation to the embryo, is a stringent assessment of stem cell pluripotency. However, the ability of human pluripotent stem cells (hPSCs) to form embryonic chimeras remains in question. Here we show using a stage-matching approach that human induced pluripotent stem cells (hiPSCs) and human embryonic stem cells (hESCs) have the capacity to participate in normal mouse development when transplanted into gastrula-stage embryos, providing in vivo functional validation of hPSC pluripotency. hiPSCs and hESCs form interspecies chimeras with high efficiency, colonize the embryo in a manner predicted from classical developmental fate mapping, and differentiate into each of the three primary tissue layers. This faithful recapitulation of tissue-specific fate post-transplantation underscores the functional potential of hPSCs and provides evidence that human-mouse interspecies developmental competency can occur.


Figures

None
Graphical abstract
Figure 1
Figure 1
hPSCs Form Interspecies Chimeras with High Efficiency and Contribute to All Regions of the Developing Fetus (A) Representative image of hPSCs (hiPSCs or hESCs) constitutively expressing a fluorescent reporter transgene (green) transplanted to the Early gastrula primitive streak (EG-PS, left panel), Late gastrula primitive streak (LG-PS, center panel), or Distal tip (Dis, right panel) of gastrula-stage mouse embryos (shown before culture). (B) hiPSC- and hESC-transplanted embryos showed high incidences of chimera formation. EG-PS, Early gastrula primitive streak; LG-PS, Late gastrula primitive streak; Dis, Distal. (C) Incorporation of transplanted hPSCs during mouse gastrulation was assessed in relation to the predictive fate map of the embryo. The contribution of endogenous cells of early and late gastrula-stage embryos to the developing fetus predicts the fate of hPSC graft progeny. Schematics linking primitive streak (PS) and distal (Dis) sites of early gastrula (EG) and late gastrula (LG) stage embryos with their fate in the developing fetus (early somite stage) are shown. Subregions: red, extra-embryonic mesoderm (allantois and yolk sac); dark green, trunk ventral, including lateral plate mesoderm and mid-gut endoderm; purple, anterior ventral, including foregut endoderm, heart, and anterior neural crest; orange, posterior ventral, including hindgut endoderm; light blue, brain and surface ectoderm; and yellow, posterior dorsal, including presomitic mesoderm. See also Figure S1 for a representative image of fetus after culture. (D) Representative wholemount overlays (bright field plus fluorescence) with matched schematics illustrating subregional locations of hiPSC (top) and hESC (bottom) graft progeny after culture. hPSC graft progeny predominantly colonized embryos as dispersed populations of fluorescent cells. Green or red dots in the schematics represent clusters of cells (not individual cells) located in the specified subregion; gray dots represent fluorescent clusters located outside the specified subregion. hiPSC lines are shown as follows: FiPS, Posterior ventral; A1ATD-1, Anterior dorsal (aerial dorsal view, Anterior dorsal subregion outlined), Trunk dorsal, Trunk ventral, Posterior dorsal, and Extra-embryonic; and BBHX8, Anterior ventral (left side view of heart region outlined). hESC lines are shown as follows: H9, Trunk ventral, Posterior ventral, and Extra-embryonic; and Shef-6, Anterior dorsal, Anterior ventral, Trunk dorsal, and Posterior dorsal. Cluster score for each illustrated embryo was >4, except for Anterior ventral hESC embryo, which was 3. (E) Regional incorporation of hPSC progeny follows classical fate distribution. Summaries of number of chimeric embryos and subregional distribution of graft progeny following transplantation of hiPSCs (combined BBHX8, A1ATD-1, and FiPS data) and hESCs (combined H9 and Shef6 data) to the primitive streak (PS) of early gastrula (EG) and late gastrula (LG) stage mouse embryos or distal region (Dis) are shown. Embryos were scored as wholemounts for subregional incorporation, where graft progeny can colonize more than one subregion. See also Table S1 for data of individual hiPSC and hESC lines.
Figure 2
Figure 2
hPSC Graft Progeny Disperse in Host Embryos and Integrate within Their Residing Tissue Region (A–F) Dispersion of graft-derived cells in host embryos is indicative of proper tissue integration. Dispersion was assessed for both hiPSCs (A1ATD-1 and FiPS combined data) and hESCs (H9 and Shef-6 combined data) using the following parameters: graft linear dispersion; graft spread as a fraction of embryo rostro-caudal length; area occupied by graft cell descendants; and graft cell number. EG-PS, Early gastrula primitive streak; LG-PS, Late gastrula primitive streak; Dis, Distal. (A) hPSC progeny graft dispersion was measured along the greatest linear axis of the progeny population (see Supplemental Experimental Procedures). Graft progeny were extensively dispersed (mean ± SEM). (B) The extent of graft progeny spread was assessed as a fraction of embryo rostro-caudal length (<1/4, 1/4–1/2, or >1/2). (C) Examples of embryos with graft progeny spread of <1/4, 1/4–1/2, and >1/2. (D) Area covered by dispersed graft progeny (mean ± SEM). (E) Cell numbers were assessed in wholemount embryos as <20, 20–40, 40–80, or >80 cells. (F) Examples of embryos with <20, 20–40, 40–80, or >80 cells. (G–V) Differentiated hPSCs co-localize with their residing tissue region. Integration of hiPSC (G–N) and hESC (O–V) graft progeny was confirmed by immunostaining for specific tissue protein markers of the regions in which they resided. Co-localization of the fluorescent reporter and staining for marker gene expression in hPSC progeny (indicated by white arrowheads) confirmed tissue-specific gene expression; yellow arrowheads indicate non-co-localized graft progeny. Arrowheads are not representative of cell number. Insets show gene expression channel plus DAPI of region with hPSC progeny (with white arrowheads denoting hPSC progeny). (G) Schematic diagram of approximate section plane in hiPSC transplanted embryos at somite stage (left) or egg cylinder stage (right): (H), (I), (K), and (L), sagittal sections; (J), (M), and (N), cross sections. (H) TBX6 staining, showing nuclear localized H2B-Venus-expressing BBHX8 (BBHX8) progeny in presomitic mesoderm. (I) TBX6 staining, showing cellular localized Cherry-expressing FiPS (FiPS) progeny in presomitic mesoderm. (J) SOX1 staining, showing FiPS progeny in neuroectoderm. (K) FOXA2 staining, showing BBHX8 progeny in definitive endoderm of the egg cylinder. (L) Phalloidin staining, showing BBHX8 progeny in presomitic mesoderm. (M) SNAI1 staining, showing FiPS progeny in brain mesenchyme. (N) SOX2 staining, showing FiPS progeny in neuroectoderm. (O) Schematic diagram of approximate section plane in hESC transplanted embryos at somite stage: (P), sagittal sections; (Q)–(S), cross sections; (T)–(V), frontal sections. (P) TBX6 staining, showing cellular localized GFP-expressing H9 (H9) progeny in presomitic mesoderm. (Q) AP-2 alpha staining, showing H9 progeny in surface ectoderm. (R) PDGF receptor β staining, showing H9 progeny in branchial arch mesenchyme. (S) FOXA2 staining, showing H9 progeny in hindgut endoderm. (T) Troponin T staining, showing cellular localized tdTomato-expressing Shef-6 (Shef-6) progeny in heart. (U) Phalloidin staining, showing BBHX8 progeny in endoderm and mesoderm. (V) SOX1 staining, showing Shef-6 progeny in neuroectoderm. For (A)–(F), see also Table S2 for graft progeny rostro-caudal spread and cell number data of individual hiPSC and hESC lines. For (G)–(V), see also Figure S2 for separate channel images of each germ layer.

Comment in

References

    1. Bradley A., Evans M., Kaufman M.H., Robertson E. Formation of germ-line chimaeras from embryo-derived teratocarcinoma cell lines. Nature. 1984;309:255–256. - PubMed
    1. Brons I.G.M., Smithers L.E., Trotter M.W.B., Rugg-Gunn P., Sun B., Chuva de Sousa Lopes S.M., Howlett S.K., Clarkson A., Ahrlund-Richter L., Pedersen R.A., Vallier L. Derivation of pluripotent epiblast stem cells from mammalian embryos. Nature. 2007;448:191–195. - PubMed
    1. Buehr M., Meek S., Blair K., Yang J., Ure J., Silva J., McLay R., Hall J., Ying Q.-L., Smith A. Capture of authentic embryonic stem cells from rat blastocysts. Cell. 2008;135:1287–1298. - PubMed
    1. Chen Y., Niu Y., Li Y., Ai Z., Kang Y., Shi H., Xiang Z., Yang Z., Tan T., Si W. Generation of Cynomolgus Monkey Chimeric Fetuses using Embryonic Stem Cells. Cell Stem Cell. 2015;17:116–124. - PubMed
    1. Huang Y., Osorno R., Tsakiridis A., Wilson V. In Vivo differentiation potential of epiblast stem cells revealed by chimeric embryo formation. Cell Rep. 2012;2:1571–1578. - PubMed

Publication types

LinkOut - more resources