doi: 10.5152/dir.2015.15009.
Proton magnetic resonance spectroscopy in oncology: the fingerprints of cancer?
Affiliations
- PMID: 26712681
- PMCID: PMC4712903
- DOI: 10.5152/dir.2015.15009
Item in Clipboard
Proton magnetic resonance spectroscopy in oncology: the fingerprints of cancer?
Diagn Interv Radiol.
2016 Jan-Feb.
Abstract
Abnormal metabolism is a key tumor hallmark. Proton magnetic resonance spectroscopy (1H-MRS) allows measurement of metabolite concentration that can be utilized to characterize tumor metabolic changes. 1H-MRS measurements of specific metabolites have been implemented in the clinic. This article performs a systematic review of image acquisition and interpretation of 1H-MRS for cancer evaluation, evaluates its strengths and limitations, and correlates metabolite peaks at 1H-MRS with diagnostic and prognostic parameters of cancer in different tumor types.
Figures
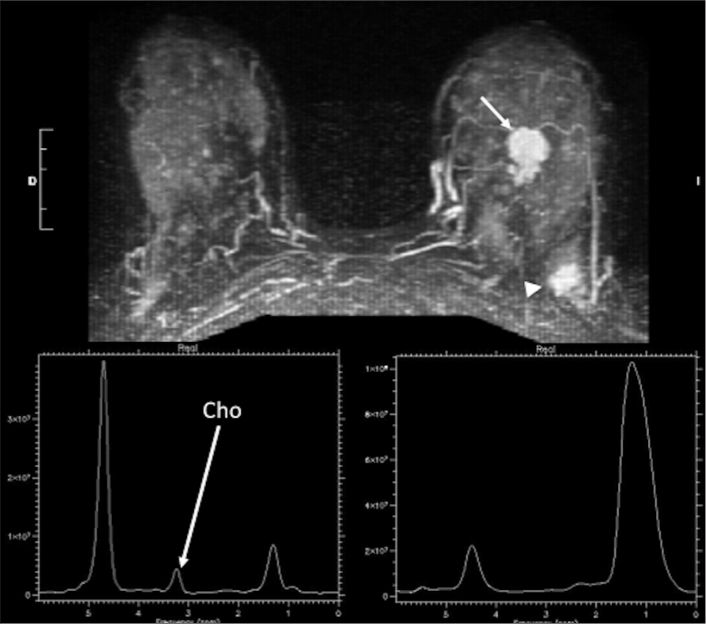
A 42-year-old woman with anterior mass (invasive ductal carcinoma) and posterior focal mastopathy area in left breast. Axial 3D contrast-enhanced fat-suppressed image at 2 minutes (top row) shows an anterior mass (arrow, invasive ductal carcinoma already biopsied and classified as a BIRADS 6 lesion), and a new posterior enhancing mass (arrowhead) with spiculated margins and curve type 3 (BIRADS 5) corresponding to a focal mastopathy area. Single-voxel MRS showed positive choline peak (long white arrow) in anterior invasive ductal carcinoma (bottom left), while it was negative in the posterior focal mastopathy area.
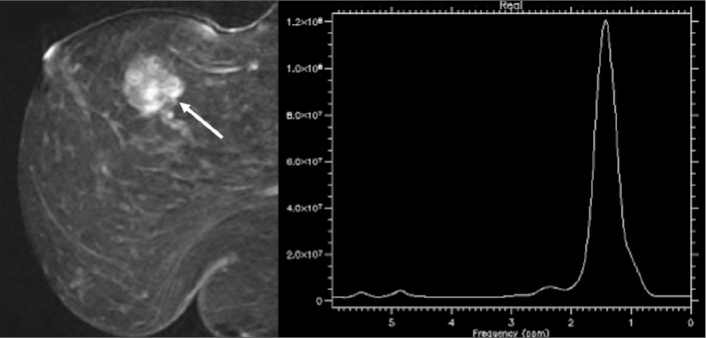
MRS as a tumor biomarker. Although, as a general rule, tumors usually show high choline levels, low-grade malignant tumors may show a negative choline resonance peak at 3.22 ppm. Sagittal 3D contrast-enhanced fat-suppressed image of a 57-year-old woman with pure mucinous carcinoma at 2 minutes (left) shows an enhancing mass with irregular contour and kinetic curve type 3 (not shown). Single-voxel spectrum (right) shows no choline resonance peak in the mass.
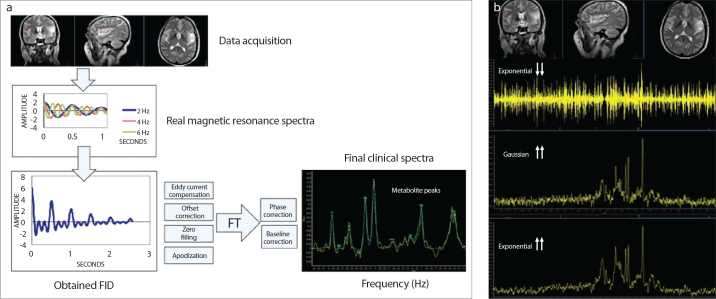
Analysis of the MRS data. Schematic representation of MRS data generation and processing (a) and change in the spectrum shape (b) when different values of exponential or Gaussian functions are used in single-voxel MRS of a brain exam. Magnetic resonance spectra usually comprise more than a single frequency (a, top-left). What we actually observe in a magnetic resonance free induction decay (FID) (bottom-left) is their sum, which results in a complex signal that cannot be analyzed in a simple way. The traditional way to determine the different resonances present in this complex signal is by means of a mathematical procedure known as Fourier transform. In addition, acquired MRS signals require a preprocessing process to minimize error in the quantitation of metabolites (e.g., eddy current compensation, zero filling). Finally, the result of this processing should be a series of metabolite peaks (right) characterized by their principal descriptors: frequency (chemical shift) and amplitude. Change in the spectrum shape when different values of exponential or Gaussian functions are used (b). Manipulating the same FID with different window functions (b) (e.g., exponential/Gaussian) will help to increase the resolution, but at the cost of worsening the SNR or introducing artifacts in the spectrum.
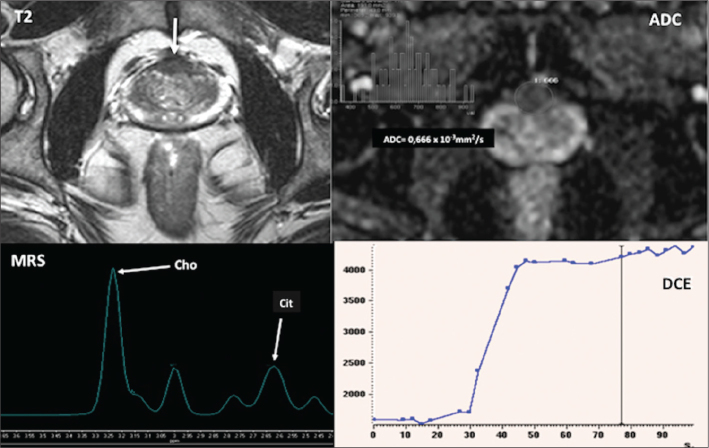
Multiparametric imaging in prostate cancer imaging. A 65-year-old man with rising PSA values and two previous negative biopsies. T2-weighted and apparent diffusion coefficient (ADC) parametric map (top row) and MR spectrum and dynamic contrast-enhanced (DCE) time-signal curve (bottom row) show an anterior prostate mass (arrow). T2 image shows an infiltrating mass with extension into the anterior capsule. The mass presents a reduced ADC value (mean ADC=0.666×10⁻³ mm2/s). On multiple-voxel MRS, choline is significantly elevated compared to citrate and DCE demonstrates a type 2 curve. All these findings suggest a high probability of malignancy. Biopsy confirmed a Gleason 8 prostate cancer.
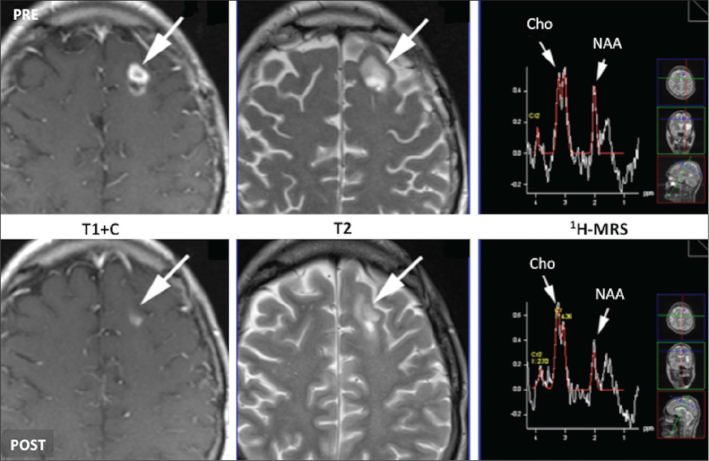
Multiparametric MRI of therapy response evaluation. Grade III glioma of the left frontal lobe. Rows: serial images obtained before and after administration of bevacizumab plus temozolamide including postcontrast T1-weighted and T2-weighted images and single-voxel 1H-MRS spectra. Reduced enhancement and decreased tumor size is seen after treatment. However, an increased choline/N-acetylaspartate (NAA) ratio suggests no tumor response. These apparent contradictory findings may be secondary to the restoration of the blood-brain barrier as a result of antiangiogenic therapy. This feature explains a lower enhancement on T1-weighted contrast-enhanced image following therapy and a reduction in edema, which may be responsible for the changes in T2 image. Although these imaging findings may suggest tumor response, MRS findings do not support it, reinforcing the role of a multiparametric evaluation of the tumor phenotype.
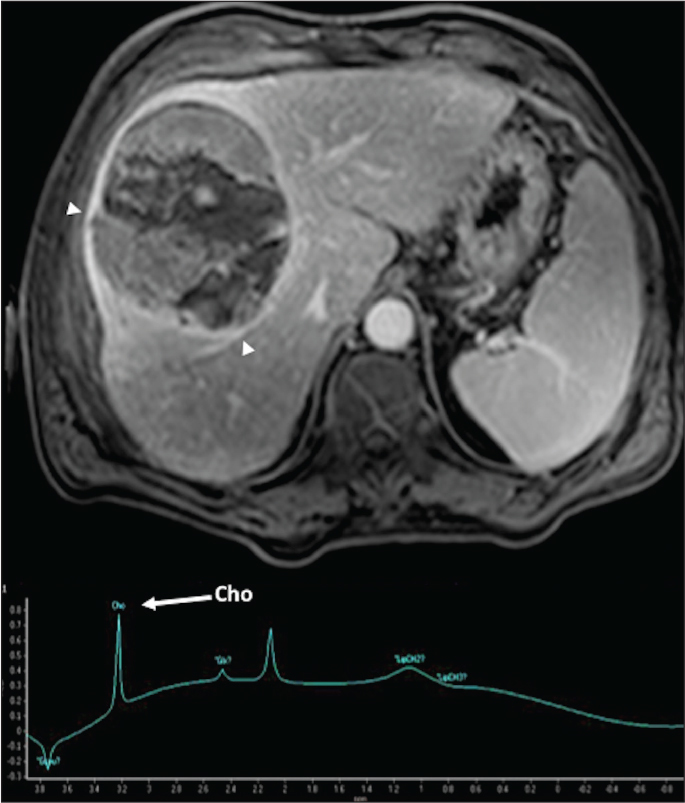
A 68-year-old man with hepatocellular carcinoma. Axial contrast-enhanced T1-weighted gradient-echo image in the delayed phase demonstrates a big encapsulated mass (arrows). Single-voxel MR spectrum depicts a choline peak within this mass.
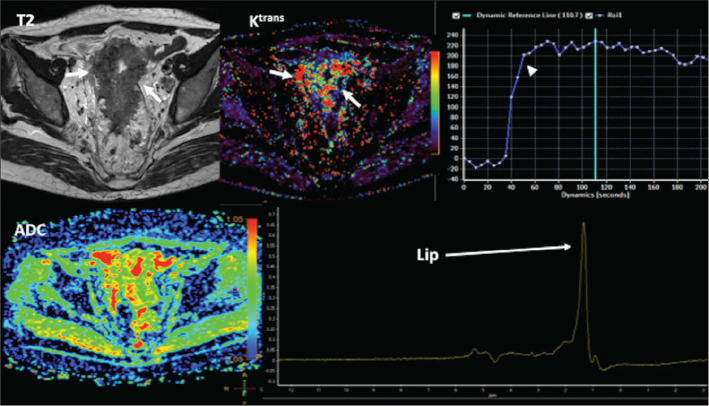
A 74-year-old man with an advanced rectosigmoid malignant tumor. Axial T2-weighted image, constant transfer (Ktrans) parametric map, and time-signal intensity curve (top row) and ADC color-scaled parametric map and single-voxel MR spectrum (bottom row) demonstrate a bulky rectosigmoid tumor (arrows) with areas of increased Ktrans, a type 2 curve (arrowhead), and low ADC values. MRS evidences a lipid peak in the tumor.
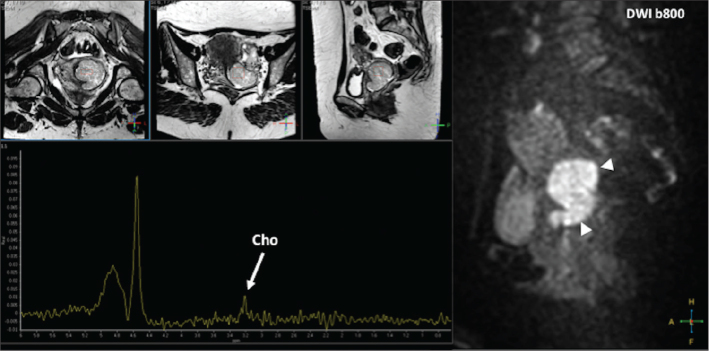
A 47-year-old woman with a malignant tumor of the cervix. Sagittal diffusion-weighted image (b value=800) (right) demonstrates a big tumor in the uterine cervix with restricted diffusion (arrowheads). T2-weighted images in different planes (top left) show the position of the MRS voxel. Single-voxel MRS depicts the presence of a choline peak in the tumor.
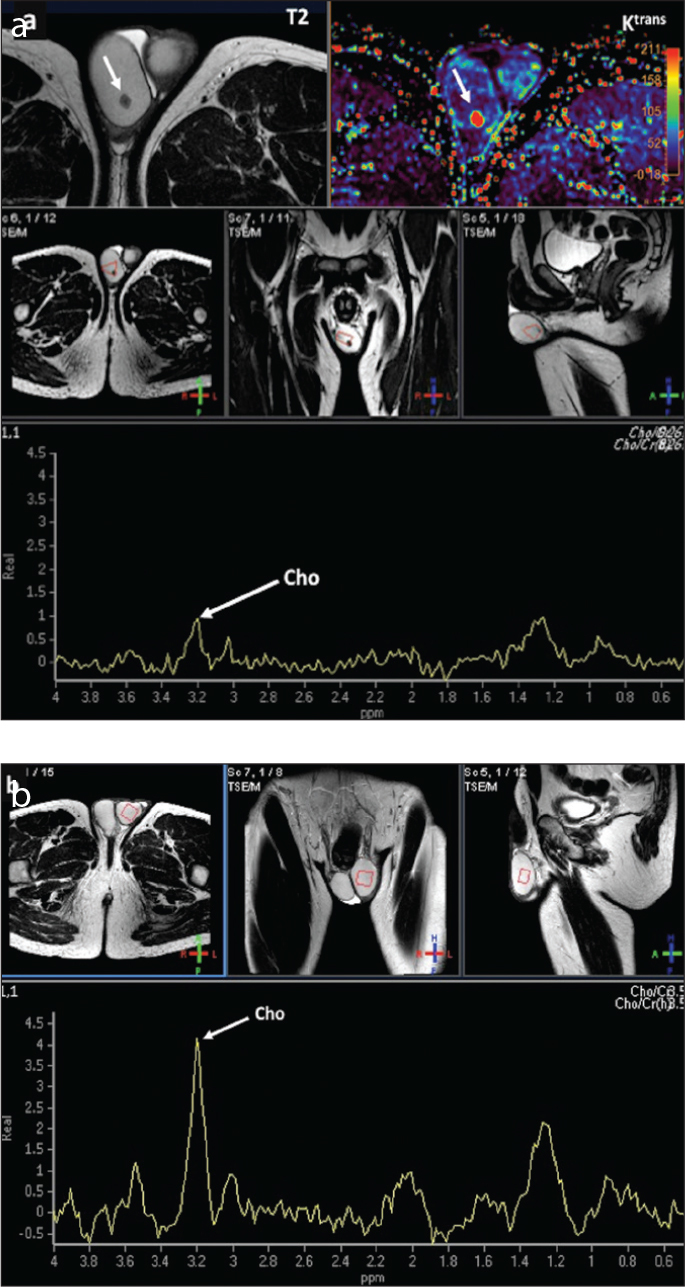
A 39-year-old man with a seminoma. Multiparametric MRI evaluations of the tumor (a) and the contralateral healthy testicle (b). Tumor evaluation (a) shows a small lesion on axial plane (white arrows) in the right testicle. T2-weighted image and constant transfer (Ktrans) parametric map (top row) demonstrate a small lesion with low signal on T2 and increased Ktrans values which correspond to a seminoma. T2-weighted images in different planes (second row) show the position of the MRS voxel. Single-voxel MRS shows a low choline peak (white arrow) in the tumor. MRS of the contralateral healthy testicle (b) in the same patient shows a higher choline peak (white arrow) in the normal parenchyma of this testicle compared with the tumor. (Note: same scale has been used for visual comparison).
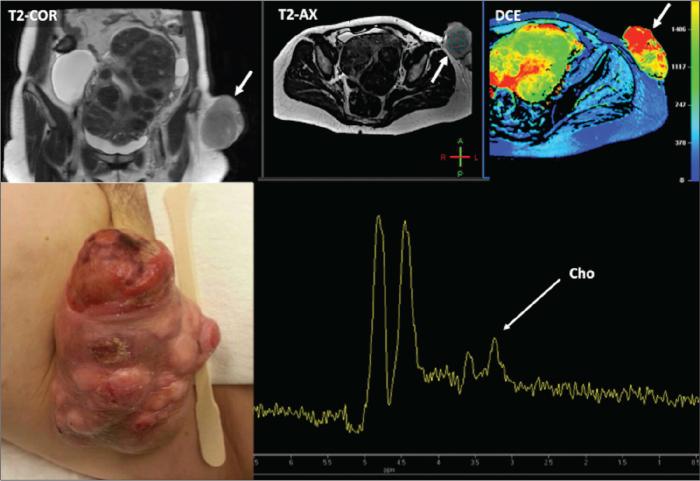
A 39-year-old woman with a malignant soft tissue mass corresponding to a dermatofibrosarcoma protuberans (bottom left image – clinical picture). Coronal and axial T2-weighted images and wash-in parametric map derived from a dynamic contrast-enhanced acquisition (top right) demonstrate a well-vascularized exophytic tumor in the left groin (white arrows). Single-voxel MRS shows a choline peak (bottom right).
Similar articles
-
Deciphering the role of glial cell-specific metabolites as biomarkers in early cervical myelopathy-insights from in vivo MRS study.Spine J. 2025 May 24:S1529-9430(25)00272-4. doi: 10.1016/j.spinee.2025.05.031. Online ahead of print. Spine J. 2025. PMID: 40418991
-
MRI software and cognitive fusion biopsies in people with suspected prostate cancer: a systematic review, network meta-analysis and cost-effectiveness analysis.Health Technol Assess. 2024 Oct;28(61):1-310. doi: 10.3310/PLFG4210. Health Technol Assess. 2024. PMID: 39367754 Free PMC article.
-
Neurochemical changes in patients with chronic low back pain detected by proton magnetic resonance spectroscopy: A systematic review.Neuroimage Clin. 2016 Nov 24;13:33-38. doi: 10.1016/j.nicl.2016.11.006. eCollection 2017. Neuroimage Clin. 2016. PMID: 27920977 Free PMC article.
-
Positron emission tomography (PET) and magnetic resonance imaging (MRI) for the assessment of axillary lymph node metastases in early breast cancer: systematic review and economic evaluation.Health Technol Assess. 2011 Jan;15(4):iii-iv, 1-134. doi: 10.3310/hta15040. Health Technol Assess. 2011. PMID: 21276372 Free PMC article.
-
Structural neuroimaging in psychosis: a systematic review and economic evaluation.Health Technol Assess. 2008 May;12(18):iii-iv, ix-163. doi: 10.3310/hta12180. Health Technol Assess. 2008. PMID: 18462577
Cited by
-
Small molecule metabolites: discovery of biomarkers and therapeutic targets.Signal Transduct Target Ther. 2023 Mar 20;8(1):132. doi: 10.1038/s41392-023-01399-3. Signal Transduct Target Ther. 2023. PMID: 36941259 Free PMC article. Review.
-
Imaging biomarkers from multiparametric magnetic resonance imaging are associated with survival outcomes in patients with brain metastases from breast cancer.Eur Radiol. 2018 Nov;28(11):4860-4870. doi: 10.1007/s00330-018-5448-5. Epub 2018 May 16. Eur Radiol. 2018. PMID: 29770848
-
1H-MRS application in the evaluation of response to photo-thermal therapy using iron oxide-gold core-shell nanoparticles, an in vivo study.Photochem Photobiol Sci. 2021 Feb;20(2):245-254. doi: 10.1007/s43630-021-00012-2. Epub 2021 Feb 9. Photochem Photobiol Sci. 2021. PMID: 33721249
-
DKI and 1H-MRS in angiogenesis evaluation of soft tissue sarcomas: a prospective clinical study based on MRI-pathology control method.BMC Med Imaging. 2024 Dec 18;24(1):340. doi: 10.1186/s12880-024-01526-8. BMC Med Imaging. 2024. PMID: 39695437 Free PMC article.
-
The Use of Magnetic Resonance Imaging in Radiation Therapy Treatment Simulation and Planning.J Magn Reson Imaging. 2024 Nov;60(5):1786-1805. doi: 10.1002/jmri.29246. Epub 2024 Jan 24. J Magn Reson Imaging. 2024. PMID: 38265188 Review.
References
-
- Hajek M, Dezortova M. Introduction to clinical in vivo MR spectroscopy. Eur J Radiol. 2008;67:185–193. http://dx.doi.org/10.1016/j.ejrad.2008.03.002. - DOI - PubMed
-
- Glunde K, Bhujwalla ZM. Metabolic tumor imaging using magnetic resonance spectroscopy. Semin Oncol. 2011;38:26–41. http://dx.doi.org/10.1053/j.seminoncol.2010.11.001. - DOI - PMC - PubMed
-
- Glunde K, Bhujwalla ZM, Ronen SM. Choline metabolism in malignant transformation. Nat Rev Cancer. 2011;11:835–848. http://dx.doi.org/10.1038/nrc3162. - DOI - PMC - PubMed
-
- Kwock L, Smith JK, Castillo M, et al. Clinical role of proton magnetic resonance spectroscopy in oncology: brain, breast, and prostate cancer. Lancet Oncol. 2006;7:859–868. http://dx.doi.org/10.1016/S1470-2045(06)70905-6. - DOI - PubMed
-
- Jansen JF, Carlson DL, Lu Y, et al. Correlation of a prior DCE-MRI and (1)H-MRS data with molecular markers in neck nodal metastases: Initial analysis. Oral Oncol. 2012;48:717–722. http://dx.doi.org/10.1016/j.oraloncology.2012.02.001. - DOI - PMC - PubMed
Publication types
MeSH terms
LinkOut - more resources
Full Text Sources
Other Literature Sources