. 2015 Dec 25;17(1):24.
doi: 10.3390/ijms17010024.

Compartmentalization and Functionality of Nuclear Disorder: Intrinsic Disorder and Protein-Protein Interactions in Intra-Nuclear Compartments

Affiliations

Compartmentalization and Functionality of Nuclear Disorder: Intrinsic Disorder and Protein-Protein Interactions in Intra-Nuclear Compartments

Fanchi Meng et al. Int J Mol Sci. .

Abstract

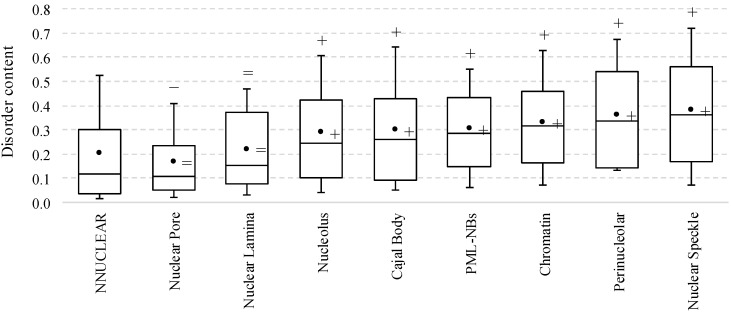
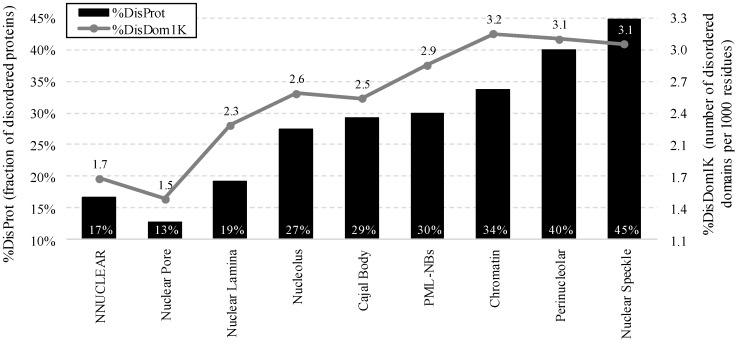
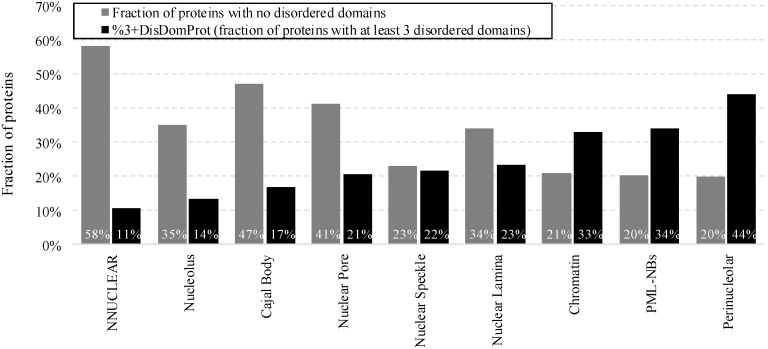
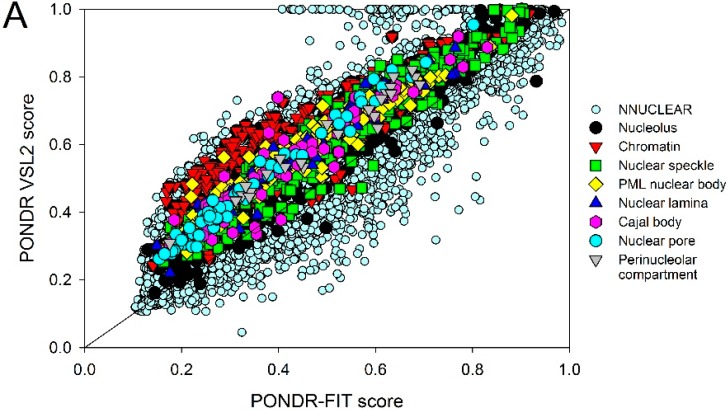
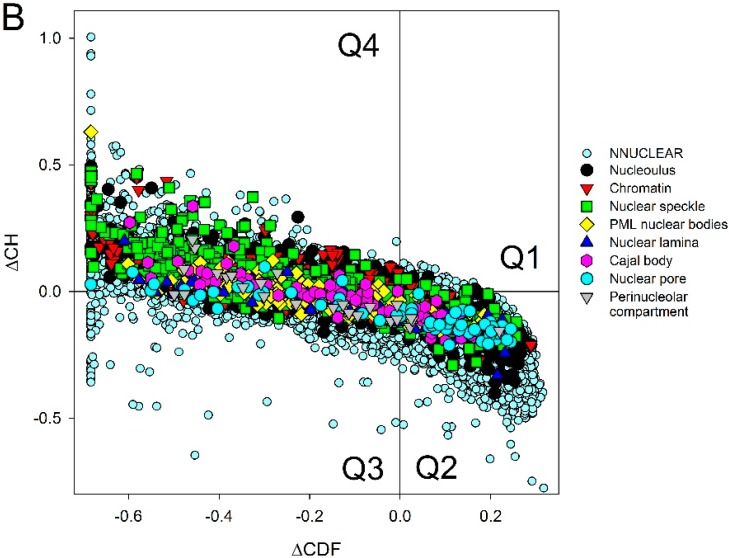
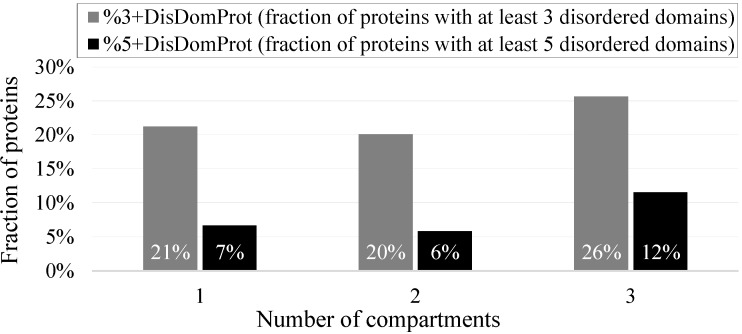
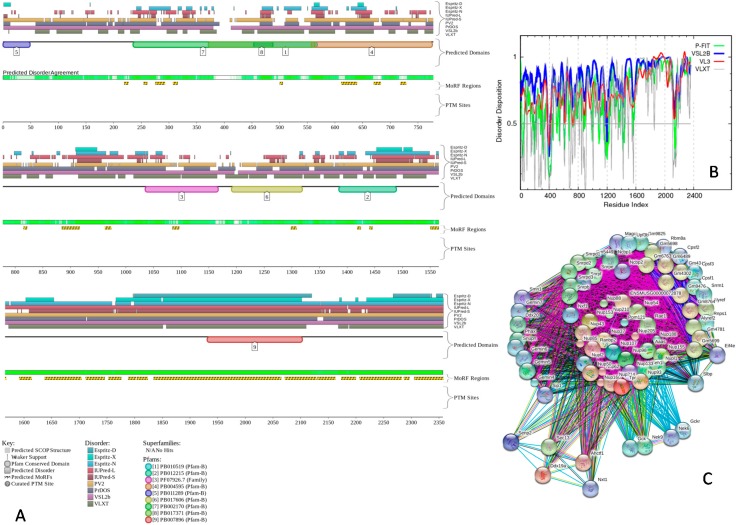
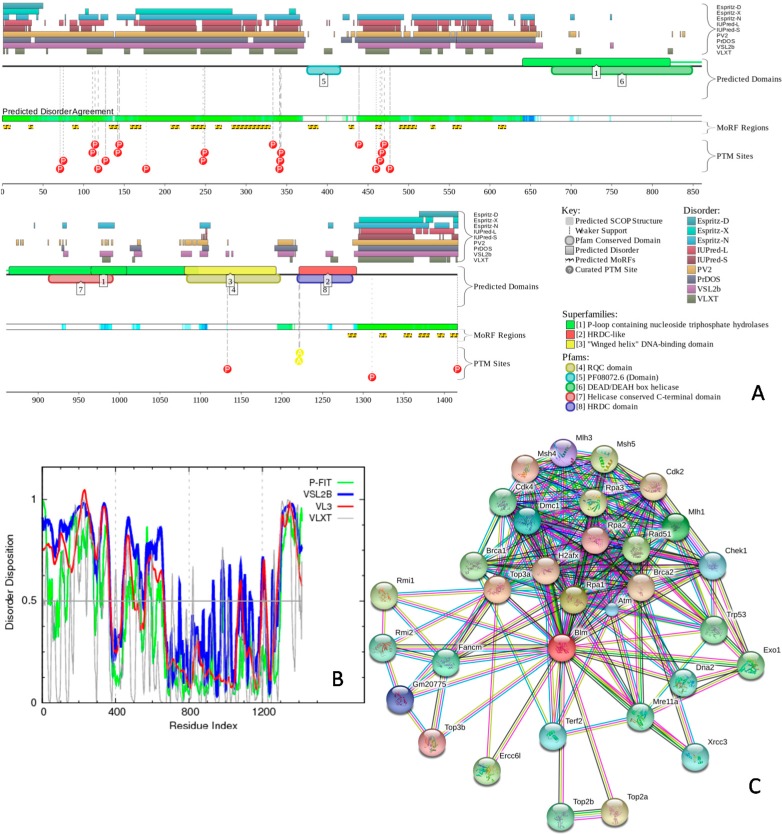
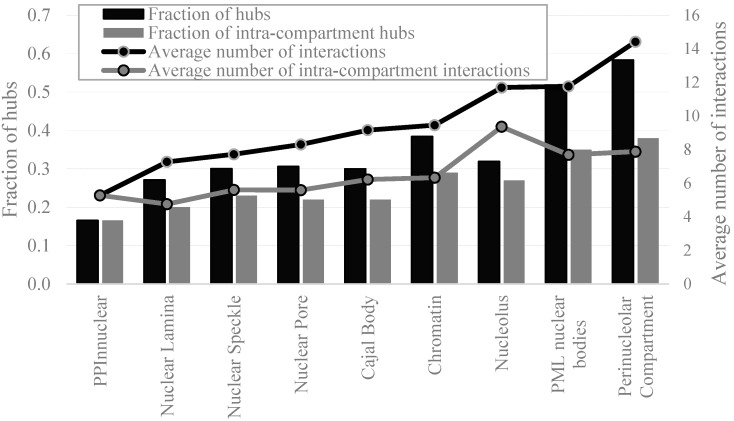
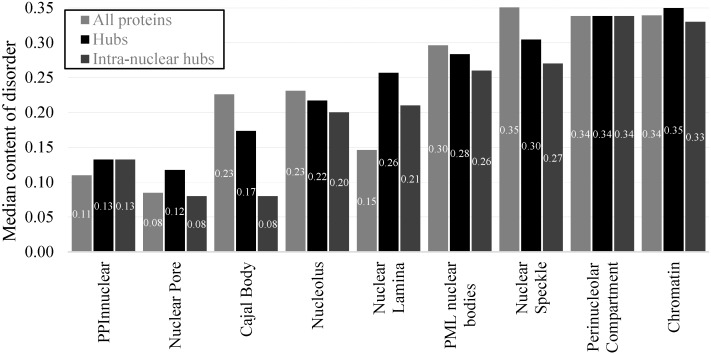
The cell nucleus contains a number of membrane-less organelles or intra-nuclear compartments. These compartments are dynamic structures representing liquid-droplet phases which are only slightly denser than the bulk intra-nuclear fluid. They possess different functions, have diverse morphologies, and are typically composed of RNA (or, in some cases, DNA) and proteins. We analyzed 3005 mouse proteins localized in specific intra-nuclear organelles, such as nucleolus, chromatin, Cajal bodies, nuclear speckles, promyelocytic leukemia (PML) nuclear bodies, nuclear lamina, nuclear pores, and perinuclear compartment and compared them with ~29,863 non-nuclear proteins from mouse proteome. Our analysis revealed that intrinsic disorder is enriched in the majority of intra-nuclear compartments, except for the nuclear pore and lamina. These compartments are depleted in proteins that lack disordered domains and enriched in proteins that have multiple disordered domains. Moonlighting proteins found in multiple intra-nuclear compartments are more likely to have multiple disordered domains. Protein-protein interaction networks in the intra-nuclear compartments are denser and include more hubs compared to the non-nuclear proteins. Hubs in the intra-nuclear compartments (except for the nuclear pore) are enriched in disorder compared with non-nuclear hubs and non-nuclear proteins. Therefore, our work provides support to the idea of the functional importance of intrinsic disorder in the cell nucleus and shows that many proteins associated with sub-nuclear organelles in nuclei of mouse cells are enriched in disorder. This high level of disorder in the mouse nuclear proteins defines their ability to serve as very promiscuous binders, possessing both large quantities of potential disorder-based interaction sites and the ability of a single such site to be involved in a large number of interactions.

Keywords: DNA-binding protein; RNA-binding protein; cell nucleus; intra-nuclear compartments; intrinsically disordered protein; membrane-less organelles.


Figures

Figure 1
Figure 1
Disorder content of the non-nuclear proteins from the NNUCLEAR dataset and proteins in the considered intra-nuclear compartment from the NUCLEARap dataset. The box plots include the first quartile, median and third quartile while whiskers correspond to the 10th and 90th centiles of the disorder content of proteins in a given set. The black circle marker is the mean value of the disorder content. The significance of the differences in the median (mean) disorder content between proteins in a given compartment and non-nuclear proteins is annotated above the whiskers (right of the marker); + and − mean that the content of the nuclear proteins is significantly higher and lower (p-value < 0.01), respectively; “=” means that the difference is not significant (p-value ≥ 0.01). Disorder was annotated with the consensus of Espritz and IUPred.
Figure 2
Figure 2
Fraction of disordered proteins (black bars) and normalized number of disordered domains (gray line) for the non-nuclear proteins from the NNUCLEAR dataset and proteins in the considered intra-nuclear compartment from the NUCLEARap dataset. Disorder was annotated with the consensus of Espritz and IUPred.
Figure 3
Figure 3
Fraction of proteins with no disordered domains (gray bars) and with at least 3 disordered domains (%3+DisDomProt) (black bars) for the non-nuclear proteins from the NNUCLEAR dataset and proteins in the considered intra-nuclear compartment from the NUCLEARap dataset. Disorder was annotated with the consensus of Espritz and IUPred.
Figure 4
Figure 4
Abundance of intrinsic disorder in mouse proteins. (A) Per-proteins propensities for disorder (average of the corresponding per-residue propensities) evaluated by PONDR-FIT (x-axis) and by PONDR® VSL2 (85) (y-axis) for the non-nuclear proteins from the NNUCLEAR dataset and proteins in the considered intra-nuclear compartment from the NUCLEARap dataset; (B) Evaluation of intrinsic disorder in mouse proteins (NNUCLEAR and NUCLEARap datasets) by CH-CDF analysis. In this figure, each point’s coordinates were computed as follows: the y-axis represents the distance of the protein in the CH-plot from the boundary, while the x-axis shows the average distance between the CDF boundary and the respective CDF curve. The figure is split into four quadrants/sections, with each quadrant representing a different family of predictions. Q1 shows proteins predicted to be ordered by CDFs but disordered by CH-plots. Q2 displays proteins that are completely ordered. Q3 shows proteins that were predicted as compact by CH-plots but disordered by CDFs (i.e., hybrid proteins or putative molten globules). Finally, Q4 portrays proteins which both methods predicted to be disordered. Proteins found in different sub-nuclear compartments are indicated by differently colored symbols. In both plots, mouse non-nuclear proteins are shown by small light blue circles. Proteins in different nuclear compartments are indicated as follows: nucleolus —black circles; chromatin—red inverted triangles; nuclear speckles—green squares; PML nuclear bodies—yellow diamonds; nuclear lamina—blue triangles; Cajal bodies—pink hexagons; nuclear pore—cyan circles; and perinucleolar compartment—gray inverted triangles.
Figure 4
Figure 4
Abundance of intrinsic disorder in mouse proteins. (A) Per-proteins propensities for disorder (average of the corresponding per-residue propensities) evaluated by PONDR-FIT (x-axis) and by PONDR® VSL2 (85) (y-axis) for the non-nuclear proteins from the NNUCLEAR dataset and proteins in the considered intra-nuclear compartment from the NUCLEARap dataset; (B) Evaluation of intrinsic disorder in mouse proteins (NNUCLEAR and NUCLEARap datasets) by CH-CDF analysis. In this figure, each point’s coordinates were computed as follows: the y-axis represents the distance of the protein in the CH-plot from the boundary, while the x-axis shows the average distance between the CDF boundary and the respective CDF curve. The figure is split into four quadrants/sections, with each quadrant representing a different family of predictions. Q1 shows proteins predicted to be ordered by CDFs but disordered by CH-plots. Q2 displays proteins that are completely ordered. Q3 shows proteins that were predicted as compact by CH-plots but disordered by CDFs (i.e., hybrid proteins or putative molten globules). Finally, Q4 portrays proteins which both methods predicted to be disordered. Proteins found in different sub-nuclear compartments are indicated by differently colored symbols. In both plots, mouse non-nuclear proteins are shown by small light blue circles. Proteins in different nuclear compartments are indicated as follows: nucleolus —black circles; chromatin—red inverted triangles; nuclear speckles—green squares; PML nuclear bodies—yellow diamonds; nuclear lamina—blue triangles; Cajal bodies—pink hexagons; nuclear pore—cyan circles; and perinucleolar compartment—gray inverted triangles.
Figure 5
Figure 5
Fraction of proteins with 3 or more (%3+DisDomProt) and 5 or more (%5+DisDomProt) disordered domains for the nuclear proteins from the NUCLEARap dataset localized in 1, 2, and 3 intra-nuclear compartments. Disorder was annotated with the consensus of Espritz and IUPred.
Figure 6
Figure 6
Abundance and functionality of intrinsic disorder in the nuclear pore complex-associated intra-nuclear coiled-coil protein TPR (UniProt ID: Q7M739). (A) Evaluation of the functional intrinsic disorder propensity by the D2P2 database (http://d2p2.pro/) [55]. In the corresponding plot, the colored bars at the top are representative of the location of disordered regions obtained from different disorder predictors (including IUPred-L, IUPred-S, Espritz-D, Espritz-N, Espritz-X, PONDR® VSL2b, PONDR® VLXT, PV2, and PrDOS). Location of predicted and known domains are shown by numbered colored bars. The white-and-green bars display the agreement in the predicted disorder among the aforementioned predictors, with green parts indicating regions that are disordered by consensus. The yellow bar indicates the location of the predicted disorder-based binding site (MoRF region), whereas red and yellow circles at the bottom of the plots show locations of phosphorylation and acetylation sites, respectively. Vertical dashed lines show actual positions of the phosphorylation sites; (B) Evaluation of the per-residue disorder propensity based on predictors from the PONDR family. A thin line at a score of 0.5 represents the disorder threshold between disorder (>0.5) and order (<0.5); (C) Analysis of the interactivity of the nuclear pore complex-associated intra-nuclear coiled-coil protein TPR (UniProt ID: Q7M739) by STRING computational platform [78]. STRING produces the network of predicted associations for a particular protein and its interactome. The nodes in this network are proteins, while the predicted or known functional associations are the edges. When predicting the associations, seven types of evidence are used, which are indicated in the resulting network by the differently colored lines. Here, a green line represents neighborhood evidence; a red line—the presence of fusion evidence; a purple line—experimental evidence; a blue line—co-occurrence evidence; a light blue line—database evidence; a yellow line—text mining evidence; a black line—co-expression evidence [78].
Figure 7
Figure 7
Functionality and prevalence of intrinsic disorder in the bloom syndrome protein homolog (UniProt ID: O88700). (A) Evaluation of the functional intrinsic disorder propensity by the D2P2 database (http://d2p2.pro/) [55]. In the corresponding plot, the colored bars at the top are representative of the location of disordered regions obtained from different disorder predictors (including IUPred-L, IUPred-S, Espritz-D, Espritz-N, Espritz-X, PONDR® VSL2b, PONDR® VLXT, PV2, and PrDOS). Location of predicted and known domains are shown by numbered colored bars. The white-and-green portion displays the agreement in the predicted disorder among the aforementioned predictors, with green parts indicating regions that are disordered by consensus. The yellow bar indicates the location of the predicted disorder-based binding site (MoRF region), whereas red circles with “P” inside and yellow circles with “A” inside at the bottom of the plots show locations of phosphorylation and acetylation sites, respectively. Vertical dashed lines show actual positions of these phosphorylation and acetylation sites; (B) Evaluation of the per-residue disorder propensity based on predictors from the PONDR family. A thin line at a score of 0.5 represents the disorder threshold between disorder (>0.5) and order (<0.5); (C) Analysis of the interactivity of the nuclear pore complex-associated intra-nuclear coiled-coil protein TPR (UniProt ID: Q7M739) by STRING computational platform [78]. STRING produces the network of predicted associations for a particular protein and its interactome. The nodes in this network are proteins, while the predicted or known functional associations are the edges. When predicting the associations, seven types of evidence are used, which are indicated in the resulting network by the differently colored lines. Here a green line represents neighborhood evidence; a red line—the presence of fusion evidence; a purple line—experimental evidence; a blue line—co-occurrence evidence; a light blue line—database evidence; a yellow line—text mining evidence; a black line—co-expression evidence [78].
Figure 8
Figure 8
Fraction of hubs (black bars), intra-compartment hubs (gray bars), average number of interactions (black line), and average number of intra-compartments interactions (gray line) for the non-nuclear proteins from the PPINNUCLEAR dataset and proteins in the considered intra-nuclear compartment from the PPINUCLEARap dataset. Disorder was annotated with the consensus of Espritz and IUPred.
Figure 9
Figure 9
Median disorder content for all proteins (light gray bars), hubs (black bars), and intra-nuclear hubs (dark gray bars) from a given protein set including the non-nuclear proteins in the PPINNUCLEAR dataset and proteins in the considered intra-nuclear compartment from the PPINUCLEARap dataset. Disorder was annotated with the consensus of Espritz and IUPred.

Similar articles

Cited by

References

    1. Goodsell D.S. Miniseries: Illustrating the machinery of life: Eukaryotic cell panorama. Biochem. Mol. Biol. Educ. 2011;39:91–101. doi: 10.1002/bmb.20494. - DOI - PubMed
    1. Tripathi V., Prasanth K.V. eLS. John Wiley & Sons Ltd.; Chichester, UK: 2011. Cell nucleus.
    1. Hancock R., Jeon K. New Models of the Cell Nucleus: Crowding, Entropic Forces, Phase Separation, and Fractals. Academic Press; Amsterdam, The Netherlands; Boston, MA, USA; Heidelberg, Germany; London, UK; New York, NY, USA; Oxford, UK; Paris, France; San Diego, CA, USA; San Francisco, CA, USA; Singapoe; Sydney, Austrilia; Tokyo, Jaoan: 2014. p. 512.
    1. Jevtic P., Edens L.J., Vukovic L.D., Levy D.L. Sizing and shaping the nucleus: Mechanisms and significance. Curr. Opin. Cell Biol. 2014;28:16–27. doi: 10.1016/j.ceb.2014.01.003. - DOI - PMC - PubMed
    1. Fakan S. The functional architecture of the nucleus as analysed by ultrastructural cytochemistry. Histochem. Cell Biol. 2004;122:83–93. doi: 10.1007/s00418-004-0681-1. - DOI - PubMed

Publication types

LinkOut - more resources