. 2016 Jan;147(1):63-76.
doi: 10.1085/jgp.201511526.

High membrane permeability for melatonin

Affiliations

High membrane permeability for melatonin

Haijie Yu et al. J Gen Physiol. 2016 Jan.

Abstract

The pineal gland, an endocrine organ in the brain, synthesizes and secretes the circulating night hormone melatonin throughout the night. The literature states that this hormone is secreted by simple diffusion across the pinealocyte plasma membrane, but a direct quantitative measurement of membrane permeability has not been made. Experiments were designed to compare the cell membrane permeability to three indoleamines: melatonin and its precursors N-acetylserotonin (NAS) and serotonin (5-HT). The three experimental approaches were (1) to measure the concentration of effluxing indoleamines amperometrically in the bath while cells were being dialyzed internally by a patch pipette, (2) to measure the rise of intracellular indoleamine fluorescence as the compound was perfused in the bath, and (3) to measure the rate of quenching of intracellular fura-2 dye fluorescence as indoleamines were perfused in the bath. These measures showed that permeabilities of melatonin and NAS are high (both are uncharged molecules), whereas that for 5-HT (mostly charged) is much lower. Comparisons were made with predictions of solubility-diffusion theory and compounds of known permeability, and a diffusion model was made to simulate all of the measurements. In short, extracellular melatonin equilibrates with the cytoplasm in 3.5 s, has a membrane permeability of ∼1.7 µm/s, and could not be retained in secretory vesicles. Thus, it and NAS will be "secreted" from pineal cells by membrane diffusion. Circumstances are suggested when 5-HT and possibly catecholamines may also appear in the extracellular space passively by membrane diffusion.


Figures

Figure 1.
Figure 1.
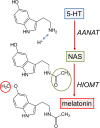
Chemical structures and enzymatic synthesis of melatonin from 5-HT. The AANAT (aralkylamine NAS) enzyme catalyzes the rate-limiting N-acetylation of 5-HT to give the intermediate NAS. The HIOMT enzyme methylates NAS to yield the hormone melatonin.
Figure 2.
Figure 2.
Amperometric detection of indoleamine leakage from a tsA201 cell. (A) Schematic showing whole-cell pipette with melatonin (Mel) and a carbon fiber amperometric electrode in the bath. (B) Amperometric oxidation currents seen as the carbon fiber electrode in the bath are advanced to almost touch the cell (down arrows) and then pulled away (up arrows) three times (representative trace). (C and D) Same as in A and B but for whole-cell pipettes containing NAS or 5-HT. For 5-HT, the trace shown is the one with the largest oxidation signal. (E) Calibration curves showing the carbon fiber sensitivity to flowing indoleamine solutions of known concentration (n = 4–5). (F) Estimated mean bath concentration (conc.) of indoleamine near the cell surface for experiments like B–D. Note the semilogarithmic axes (n = 5–10). Error bars show SEM.
Figure 3.
Figure 3.
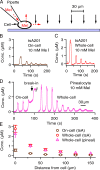
Spatial decay of the amperometric signal with melatonin. (A) Schematic of spatial measurements of melatonin (Mel) diffusion from a cell with successive carbon fiber placements (arrows) at 30-µm increments from the cell. (B) Results of an experiment with the melatonin pipette patched on a tsA201 cell before breakthrough. (C) A different tsA201 cell after breakthrough to whole-cell configuration. (D) The same kind of experiment as in B and C with a rat pinealocyte showing the transition from on-cell to whole-cell recording. Again, the carbon fiber is brought to the cell surface three times with each configuration, and then it is moved to points successively 30 µm away. (E) Mean spatial concentration profiles for on-cell and whole-cell experiments with tsA201 and pineal cells (n = 5–6). Error bars show SEM.
Figure 4.
Figure 4.
Comparing melatonin and 5-HT permeation using their fluorescence. (A) Schematic showing a monolayer of tsA201 cells on a coverslip locally perfused by a pipette containing control saline or saline supplemented by 10 mM melatonin (Mel) or 5-HT. The epi-illumination and fluorescence recordings use a 40× objective below the coverslip in a circular field of view of 39 µm that is several cell diameters wide. (B, top) Three idealized fluorescence recordings for a step pulse of perfusion with three conditions: no cells, with cells and an impermeant indoleamine, and with cells and a permeant indoleamine. (bottom) Idealized fluorescence difference traces ΔF of a record with cells minus a record without cells (see section “Influx and efflux detected by in-cell fluorescence”). (C) Five superimposed fluorescence traces from five chips without cells (gray) and from five chips with cells (purple) as melatonin and 5-HT are locally perfused for 20 s. (D) Mean difference fluorescence ΔF for the experiment in C; mean data with “No cells” are subtracted from mean data “With cells.”
Figure 5.
Figure 5.
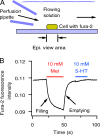
Comparing melatonin and 5-HT permeation using quenching of an intracellular fluorescent dye. (A) Schematic of a single cell on a coverslip locally perfused by a pipette containing control Ringer or Ringer supplemented by 10 mM melatonin (Mel) or 5-HT. The epi-illumination and fluorescence recordings use a 40× objective below the coverslip with a rectangular field of view stopped down to include just the one cell. (B) Mean fluorescence of fura-2-AM–loaded single cells as indoleamine solutions are perfused rapidly. The trace in B is derived from original records as follows. Separate single-cell fluorescence traces for 14 perfused coverslips were averaged and corrected for photobleaching. Traces for 12 perfused cell-free areas were treated similarly and subtracted from the with cell traces to correct for a small additional fluorescence contributed by the indoleamine compounds applied in the bath. This correction subtracted a step of fluorescence of 0.5 × 10⁻³ from the melatonin period and of 4.6 × 10⁻³ from the 5-HT period. Excitation wavelength was 370 nm.
Figure 6.
Figure 6.
Membrane permeabilities for uncharged species plotted against n-octanol/water partition coefficients for indoleamines and model compounds. Compounds and partition coefficients are from Table 2. Red circles are measurements from Orbach and Finkelstein (1980) fitted with a unity slope regression line (Eq. 3). Red crosses are compounds of physiological interest, including indoleamines predicted using Eq. 3 for lecithin membranes and assuming that they are in a 100% uncharged form. The red triangle below is indole-3-ethanol from Bean et al. (1968) measured in tocopherol/cholesterol/brain lipid membranes. Green crosses below include the indoleamines, plotted with Eq. 1a, which gives permeabilities 1,322-fold lower than Eq. 3. The green relationship is our best guess for biological membranes using Pcell for melatonin set at 1.7 µm/s. Note that for all compounds that protonate, the practical permeability will be lowered further as a function of pH because the charged forms are nearly impermeant. Such reduced values are given as Pcell in Table 2 and Eq. 1b for pH 7.4.
Figure 7.
Figure 7.
Modeling the permeation experiments. (A) Geometry of the simulated cell and bathing medium. Spherical shells are placed every 0.5 µm from the cell center out for 150 µm. The cell membrane (red) is the boundary between the 16th and 17th shells. The arrow symbolizes diffusion of molecules between shells. (B) Simulation of the experiment in Fig. 4 D showing ΔF, the difference in melatonin fluorescence, with and without cells in the chamber while melatonin was perfused in the bath for 20 s. The axis was rescaled to match the experiment. (C) Simulation of the experiment in Fig. 5 B showing the transient decrease in Fura-2 fluorescence as melatonin is perfused in the bath. The trace is actually the calculated time course of intracellular melatonin rescaled to match the presentation of the experiment. Two dashed traces labeled 5 and 0.2 show the effect of increasing the assumed membrane permeability by 5 or decreasing it to 0.2 times the standard melatonin value. (D) Geometry of the simulated pipette. See section “Adding the pipette.” The dashed circle represents the assumed shape of the Ω-shaped on-cell membrane patch when it was needed. It has an area of 14.7 µm2 chosen to match the increase of extracellular amperometric signal upon breaking the patch to go to whole-cell configuration. (E) Schematic of the diffusion regimen in the model simulation. (F) Decay of melatonin concentration with distance in the model. Negative distances are inside the pipette. The pipette, cell, and extracellular domains are marked Pip, C, and Ex, respectively. (G) Decay with distance of molecules of different assumed membrane permeability in the model. Numbers are multipliers, so that that curve marked 10 assumes a membrane permeability of 10× the standard melatonin value of 1.7 µm/s, etc.

References

    1. Adell A., and Artigas F.. 1998. A microdialysis study of the in vivo release of 5-HT in the median raphe nucleus of the rat. Br. J. Pharmacol. 125:1361–1367. 10.1038/sj.bjp.0702206 - DOI - PMC - PubMed
    1. Aeschbach D., Lockyer B.J., Dijk D.J., Lockley S.W., Nuwayser E.S., Nichols L.D., and Czeisler C.A.. 2009. Use of transdermal melatonin delivery to improve sleep maintenance during daytime. Clin. Pharmacol. Ther. 86:378–382. 10.1038/clpt.2009.109 - DOI - PMC - PubMed
    1. Afeche S.C., Barbosa R., Scialfa J.H., Terra I.M., Cassola A.C., and Cipolla-Neto J.. 2006. Effects of the blockade of high voltage-activated calcium channels on in vitro pineal melatonin synthesis. Cell Biochem. Funct. 24:499–505. 10.1002/cbf.1270 - DOI - PubMed
    1. Bean R.C., Shepherd W.C., and Chan H.. 1968. Permeability of lipid bilayer membranes to organic solutes. J. Gen. Physiol. 52:495–508. 10.1085/jgp.52.3.495 - DOI - PMC - PubMed
    1. Bruns D., and Jahn R.. 1995. Real-time measurement of transmitter release from single synaptic vesicles. Nature. 377:62–65. 10.1038/377062a0 - DOI - PubMed

Publication types