Zinc flexes its muscle: Correcting a novel analysis of calcium for zinc interference uncovers a method to measure zinc
- PMID: 26712852
- PMCID: PMC4692492
- DOI: 10.1085/jgp.201511493
Zinc flexes its muscle: Correcting a novel analysis of calcium for zinc interference uncovers a method to measure zinc
Abstract
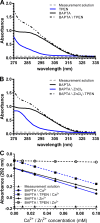
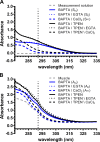
The divalent cation chelator 1,2-bis(o-aminophenoxy)ethane-N,N,N',N'-tetraacetic acid (BAPTA), often used to buffer physiological changes in cytosolic Ca(2+), also binds Zn(2+) with high affinity. In a recently published method (Lamboley et al. 2015. J. Gen. Physiol. http://dx.doi.org/10.1085/jgp.201411250), the absorbance shift of BAPTA at 292 nm was successfully used to determine the total calcium concentrations of various skeletal muscle tissues. In the present study, we show that endogenous Zn(2+) in rat skeletal muscle tissue can be unknowingly measured as "Ca(2+)," unless appropriate measures are taken to eliminate Zn(2+) interference. We analyzed two rat skeletal muscle tissues, soleus and plantaris, for total calcium and zinc using either inductively coupled plasma mass spectrometry (ICP-MS) or the BAPTA method described above. ICP-MS analysis showed that total zinc contents in soleus and plantaris were large enough to affect the determination of total calcium by the BAPTA method (calcium = 1.72 ± 0.31 and 1.96 ± 0.14, and zinc = 0.528 ± 0.04 and 0.192 ± 0.01; mean ± standard error of the mean [SEM]; n = 5; mmole/kg, respectively). We next analyzed total calcium using BAPTA but included the Zn(2+)-specific chelator N,N,N',N'-tetrakis(2-pyridylmethyl)ethylenediamine (TPEN) that buffers Zn(2+) without affecting Ca(2+)/BAPTA binding. We found that estimated concentrations of total calcium ([CaT]WM) in soleus and plantaris were reduced after TPEN addition ([CaT]WM = 3.71 ± 0.62 and 3.57 ± 0.64 without TPEN and 3.39 ± 0.64 and 3.42 ± 0.62 with TPEN; mean ± SEM; n = 3; mmole/kg, respectively). Thus, we show that a straightforward correction can be applied to the BAPTA method to improve the accuracy of the determination of total calcium that should be applicable to most any tissue studied. In addition, we show that using TPEN in combination with the BAPTA method allows one to make reasonable estimates of total zinc concentration that are in agreement with the direct determination of zinc concentration by ICP-MS.
© 2016 Qian and Colvin.
Figures


Similar articles
-
Zinc Ions Mediate Gastrin Expression, Proliferation, and Migration Downstream of the Cholecystokinin-2 Receptor.Endocrinology. 2016 Dec;157(12):4706-4719. doi: 10.1210/en.2016-1270. Epub 2016 Oct 31. Endocrinology. 2016. PMID: 27797597
-
Hydrogen peroxide-induced DNA damage is independent of nuclear calcium but dependent on redox-active ions.Biochem J. 1998 Oct 1;335 ( Pt 1)(Pt 1):85-94. doi: 10.1042/bj3350085. Biochem J. 1998. PMID: 9742216 Free PMC article.
-
New method for determining total calcium content in tissue applied to skeletal muscle with and without calsequestrin.J Gen Physiol. 2015 Feb;145(2):127-53. doi: 10.1085/jgp.201411250. J Gen Physiol. 2015. PMID: 25624449 Free PMC article.
-
TPEN, a Zn2+/Fe2+ chelator with low affinity for Ca2+, inhibits lamin assembly, destabilizes nuclear architecture and may independently protect nuclei from apoptosis in vitro.Cell Calcium. 1998 Feb-Mar;23(2-3):151-64. doi: 10.1016/s0143-4160(98)90114-2. Cell Calcium. 1998. PMID: 9601611 Review.
-
Some commonly overlooked properties of calcium buffer systems: a simple method for detecting and correcting stoichiometric imbalance in CaEGTA stock solutions.Cell Calcium. 1996 Sep;20(3):227-34. doi: 10.1016/s0143-4160(96)90028-7. Cell Calcium. 1996. PMID: 8894269 Review.
Cited by
-
A mixture of chloromethylisothiazolinone and methylisothiazolinone impairs rat vascular smooth muscle by depleting thiols and thereby elevating cytosolic Zn2+ and generating reactive oxygen species.Arch Toxicol. 2021 Feb;95(2):541-556. doi: 10.1007/s00204-020-02930-z. Epub 2020 Oct 19. Arch Toxicol. 2021. PMID: 33074372
-
Agonist-Evoked Increases in Intra-Platelet Zinc Couple to Functional Responses.Thromb Haemost. 2019 Jan;119(1):128-139. doi: 10.1055/s-0038-1676589. Epub 2018 Dec 31. Thromb Haemost. 2019. PMID: 30597507 Free PMC article.
-
Zinc Modulation of Cardiac Ryanodine Receptor Gating: Alternate Interpretation of the Interplay between Zinc and Calcium.J Biol Chem. 2016 Feb 19;291(8):4266. doi: 10.1074/jbc.L115.712109. J Biol Chem. 2016. PMID: 26896485 Free PMC article. No abstract available.
References
-
- Arslan P., Di Virgilio F., Beltrame M., Tsien R.Y., and Pozzan T.. 1985. Cytosolic Ca2+ homeostasis in Ehrlich and Yoshida carcinomas. A new, membrane-permeant chelator of heavy metals reveals that these ascites tumor cell lines have normal cytosolic free Ca2+. J. Biol. Chem. 260:2719–2727. - PubMed
MeSH terms
Substances
LinkOut - more resources
Full Text Sources
Other Literature Sources
Miscellaneous

