. 2016 Feb 2;7(5):5440-60.
doi: 10.18632/oncotarget.6706.

Expression of the FGFR2 mesenchymal splicing variant in epithelial cells drives epithelial-mesenchymal transition

Affiliations

Expression of the FGFR2 mesenchymal splicing variant in epithelial cells drives epithelial-mesenchymal transition

Danilo Ranieri et al. Oncotarget. .

Abstract

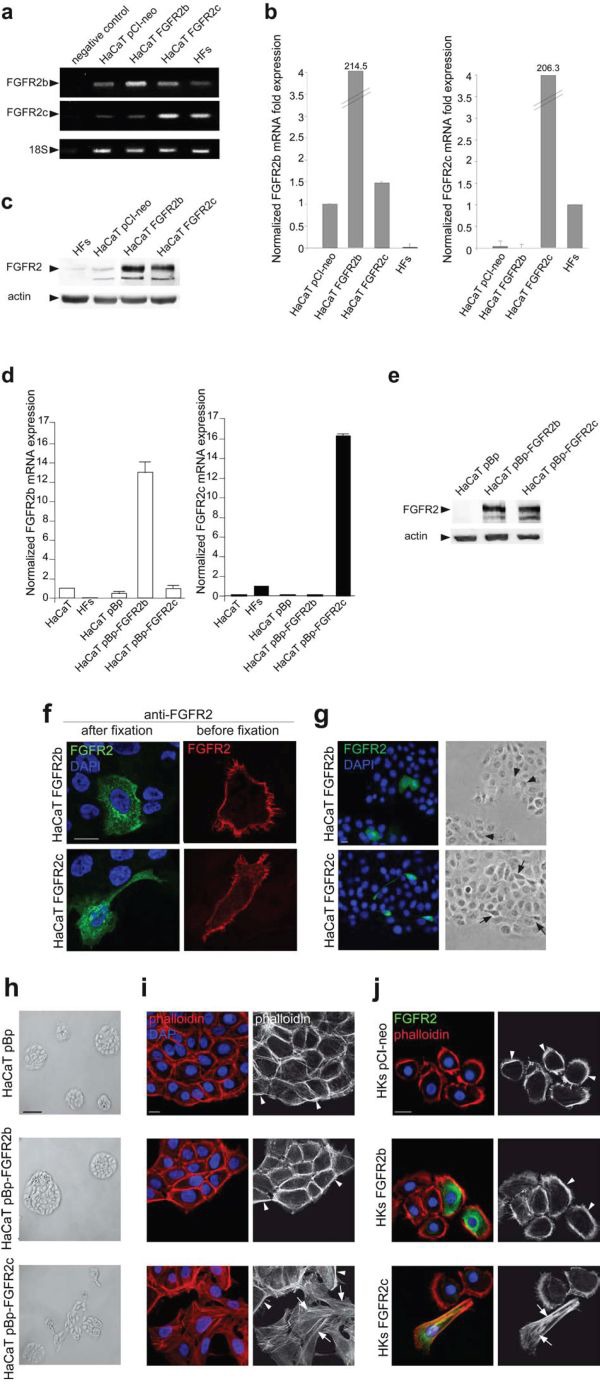
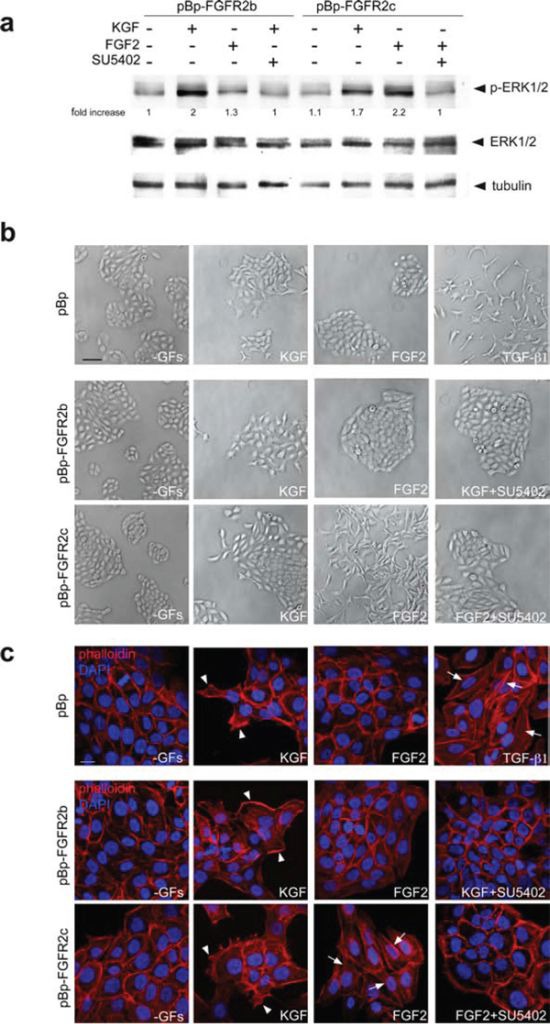
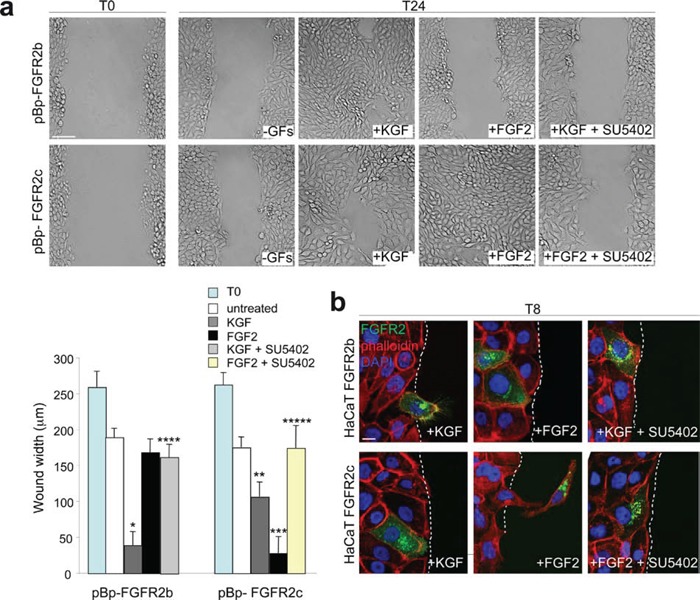
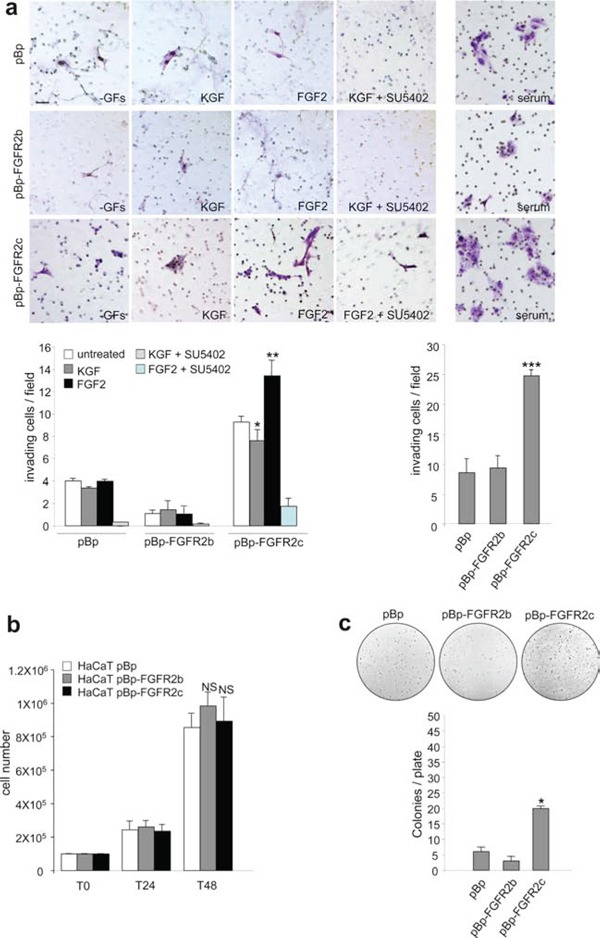
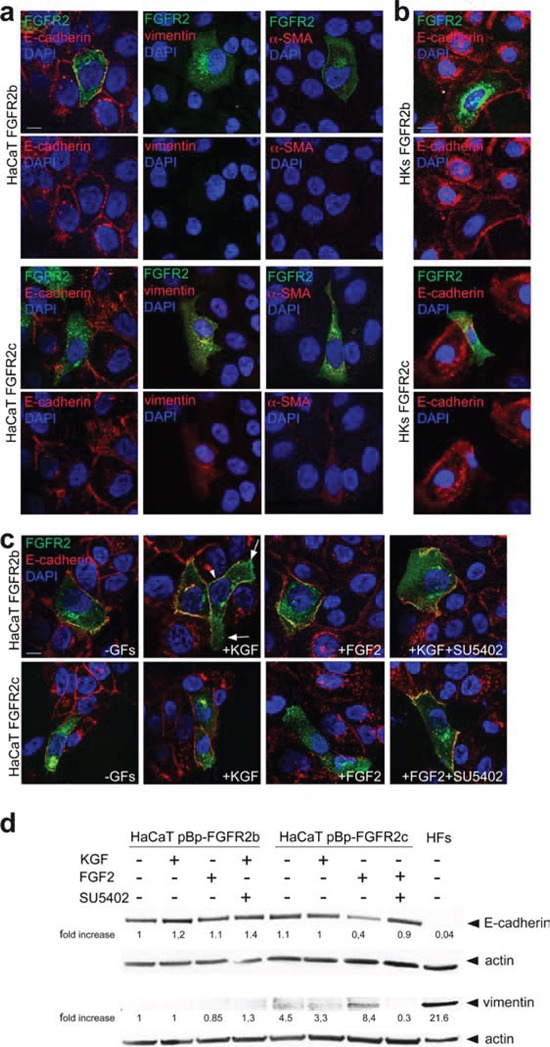
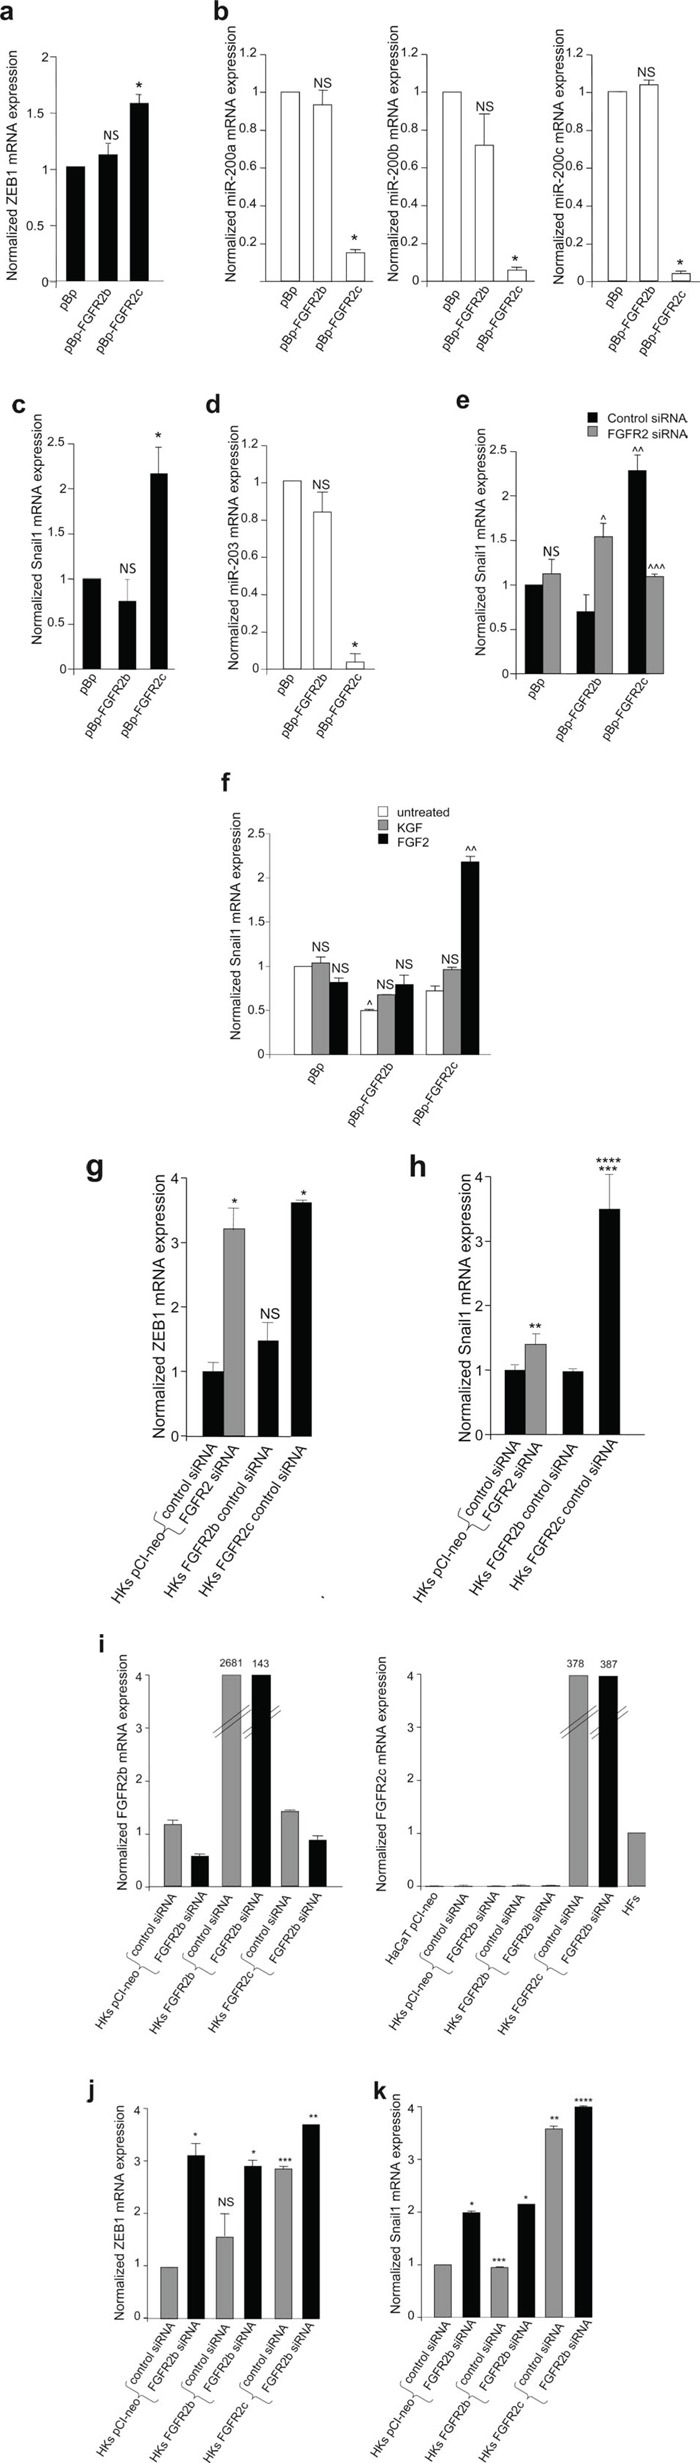
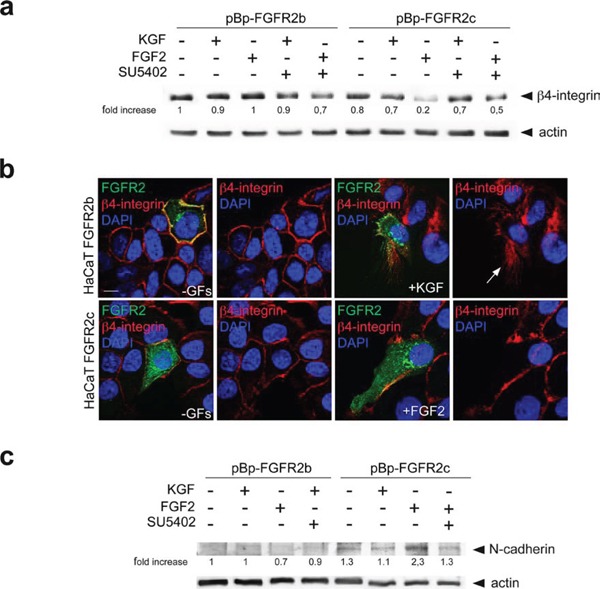
The FGFRs are receptor tyrosine kinases expressed by tissue-specific alternative splicing in epithelial IIIb or mesenchymal IIIc isoforms. Deregulation of FGF/FGFR signaling unbalances the epithelial-stromal homeostasis and may lead to cancer development. In the epithelial-context, while FGFR2b/KGFR acts as tumor suppressor, FGFR2c appears to play an oncogenic role. Based on our recent observation that the switching of FGFR2b versus FGFR2c induces EMT, here we investigated the biological outcome of the ectopic expression of FGFR2c in normal human keratinocytes. Morphological analysis showed that, differently from FGFR2b overexpression, the forced expression and activation of FGFR2c drive the epithelial cells to acquire a mesenchymal-like shape and actin reorganization. Moreover, the appearance of invasiveness and anchorage-independent growth ability in FGFR2c transfected keratinocytes was consistent with the potential tumorigenic role proposed for this receptor variant. Biochemical and molecular approaches revealed that the observed phenotypic changes were accompanied by modulation of EMT biomarkers and indicated the involvement of EMT transcription factors and miRs. Finally, the analysis of the expression pattern of discriminating markers strongly suggested that activation of FGFR2c triggers a process corresponding to the initiation of the pathological type III EMT, but not to the more physiological type II EMT occurring during FGFR2b-mediated wound healing.

Keywords: FGFR2; epithelial-mesenchymal transition; human keratinocytes.


Conflict of interest statement

CONFLICTS OF INTEREST

The authors declare no conflicts of interest.

Figures

Figure 1
Figure 1. The ectopic expression of FGFR2c affects keratinocyte morphology and their growth mode
HaCaT cells were transiently transfected with pCI-neo expression vectors containing FGFR2b or FGFR2c variants (HaCaT FGFR2b and HaCaT FGFR2c) or transduced with pBp retroviral vectors containing the two FGFR2 isoforms (HaCaT pBp-FGFR2b and HaCaT pBp-FGFR2c respectively). HaCaT, HaCaT pCI-neo and HaCaT pBp cells or a primary culture of human dermal fibroblasts (HFs) were used as controls. (a, b, d) Qualitative PCR (a) and quantitative real-time RT-PCR (b, d) show that FGFR2c mRNA expression is evident only in HaCaT cells ectopically expressing FGFR2c or in HFs; FGFR2b mRNA expression is detectable at different levels in all HaCaT cells, but not in HFs. 18S rRNA was used as internal control. (c, e) Western blot analysis, performed using anti-Bek antibodies, shows that the 140 KDa band corresponding to the molecular weight of FGFR2 is more evident in cells transfected or transduced with one of the two FGFR2 variants. The equal loading was assessed using anti-b actin antibody. (f) Immunofluorescence analysis was performed in cells incubated at 4°C with anti-Bek antibodies before cell fixation, to selectively stain plasma membrane receptors, or after fixation and permeabilization, to simultaneously visualize the FGFRs intracellularly on the cell surface. Nuclei were stained with DAPI. Receptor signals are localized on the cell plasma membranes and in intracellular dots; only the cells expressing the FGFR2c isoform appear elongated. Bar: 10μm (g) Immunofluorescence coupled to phase contrast analysis shows that FGFR2b expressing cells appear polygonal and packed (arrowheads), while FGFR2c expressing cells are spindle-shaped and detached from the neighboring ones (arrows). Bar: 10μm (h, i) Low magnification phase contrast microscopy (h) coupled to fluorescence analysis using TRITC-conjugated phalloidin (i) was performed in stably transduced cells. HaCaT pBp and HaCaT pBp-FGFR2b cultures grow in packed colonies (h), display a cobblestone shape and actin cytoskeleton organized in cortical bundles (i, arrowheads). HaCaT pBp-FGFR2c cultures show colony disorganization (h); the cortex is still evident (i, arrowheads), but peripheral cells display spindle shape and thin stress fibers (i, arrows). (i) Bar: 10μm; (h) Bar: 100μm. (j) Immunofluorescence using anti-Bek antibodies and TRITC-conjugated phalloidin was performed in HKs transiently tranfected with pCI-neo FGFR2b (HKs FGFR2b), pCI-neo FGFR2c (HKs FGFR2c) or pCI-neo empty vector (HKs pCI-neo) as control. HKs FGFR2c display a spindle-shaped morphology and actin stress fibers (Figure 1j, arrows), while HKs FGFR2b and control HKs pCI-neo maintain a cobblestone shape and peripheral actin cortex (arrowheads). Bar: 10μm.
Figure 2
Figure 2. The expression of FGFR2c and its ligand-dependent activation trigger morphological and cytoskeletal changes reminiscent to EMT
(a) HaCaT pBp-FGFR2b and HaCaT pBp-FGFR2c cells were serum starved and stimulated with KGF or FGF2 for 10 minutes in presence or not of the FGFR2 tyrosine kinase inhibitor SU5402. Western blot analysis shows that an evident phosphorylation of ERKs is induced in all cultures by KGF, while FGF2 triggers it only in HaCaT pBp-FGFR2c cells. ERK phosphorylation is decreased by treatment with SU5402. The equal loading was assessed using anti-a tubulin antibody. For densitometric analysis results are expressed as mean values from three independent experiments. (b, c) Phase contrast (b) and fluorescence analysis using phalloidin-TRITC (c) were performed in stably transduced cells stimulated with KGF or FGF2 for 24 h in presence or not of SU5402. Alternatively, HaCaT pBp cells were stimulated with TGF-b1 for 24 h. In all cultures the serum deprivation does not affect cell morphology or actin cytoskeleton organization, while KGF stimulation induces peripheral cell elongation and the appearance of lamellipodia and ruffles (c, arrowheads). Only in FGFR2c expressing cultures, FGF2 stimulation induces colony dispersion, spindle-shaped morphology and stress fiber formation (c, arrows). Similar phenotypic changes are observed in HaCaT pBp cells upon TGF-b1 stimulation (b, c, arrows). Both migratory and mesenchymal features are abrogated by SU5402. (b) Bar: 100μm; (c) Bar: 10μm.
Figure 3
Figure 3. The ligand-dependent activation of FGFR2b and FGFR2c induces comparable migratory responses in keratinocytes
(a) HaCaT pBp-FGFR2b and HaCaT pBp-FGFR2c cells were grown until confluence and a cell-free area was introduced in the monolayer using a tip. Cells were then immediately fixed (T0) or allowed to migrate for 24 h (T24) in the presence or not of KGF or FGF2. SU5402 was added to inhibit FGFR2 activity. The cell-free scratch area, evident at time 0 (T0), is partially repopulated by either untreated cells; the migratory response of pBp-FGFR2c cells to FGF2 is comparable to that observed in pBp-FGFR2b cells upon KGF stimulation. pBp-FGFR2c cells also shows a moderate response to KGF, while pBp-FGFR2b cells does not significantly respond to FGF2. Quantitative analysis of cell migration was assessed measuring the gap distance between the edges of the scratch area as reported in materials and methods. Results are expressed as mean value of three independent experiments ± standard error (SE). Student's t test was performed as reported in materials and methods and significance level has been defined as follows: *, **, *** p < 0.001 vs the corresponding untreated cells; **** p < 0.001 vs the corresponding KGF-treated cells; ***** p < 0.001 vs the corresponding FGF2-treated cells. Bar: 100μm. (b) Immunofluorescence analysis was performed using anti-Bek antibodies and phalloidin-TRITC in transiently transfected cells stimulated to migrate with KGF or FGF2 for 8 h in presence or not of SU5402. Migrating cells in response to KGF are visible in HaCaT FGFR2b cultures, while upon FGF2 stimulation fibroblast-like shaped cells invading the scratch area are detected only in HaCaT FGFR2c cultures. All ligand-induced features are abolished by SU5402. Bar: 10μm.
Figure 4
Figure 4. FGFR2c expression and signaling confer “in vitro” tumorigenic properties
(a) HaCaT pBp, HaCaT pBp-FGFR2b and HaCaT pBp-FGFR2c cells were seeded on matrigel pre-coated transwell Boyden chamber filters. Cells were then serum starved and complete medium, KGF or FGF2 in presence or not of SU5402 were added in the bottom chamber to stimulate cell chemotaxis. In unstimulated conditions, FGFR2c expressing cultures appear more invasive compared to pBp or pBp-FGFR2b cells; moreover, FGF2 further enhances, while KGF represses, this tendency. The FGF2-induced invasive behavior is abolished by SU5402. Also in presence of complete medium, pBp-FGFR2c cultures appear significantly more invasive than pBp or pBp-FGFR2b cells. Quantitative analysis was assessed as reported in materials and methods. Results are expressed as mean values ± standard deviation (SD). Student's t test was performed as reported in materials and methods and significance level has been defined as follows: * p < 0.05 and ** p < 0.01 vs the corresponding untreated cells; *** p < 0.001 vs pBp cells. Bar: 20mm. (b) Proliferation assay performed in stably transduced cells grown in complete medium. At 24 h (T24) and 48 h (T48) from seeding, cells were harvested and counted as reported in materials and methods. No significant differences in cell proliferation were found at both 24 and 48 h time points. The results are expressed as the mean values of three independent counts ± SD. Student's t test was performed as reported in materials and methods and significance level has been defined as follows: NS vs HaCaT pBp cells. (c) Stably transduced cells were trypsinized and resuspended in medium containing agar as reported in materials and methods. Quantitative analysis performed after 2 weeks reveals that only pBp-FGFR2c cultures display a significant ability to form colonies in soft agar. Results are expressed as mean values ± SD. Student's t test was performed as reported in materials and methods and significance level has been defined as follows: * p < 0.05 vs pBp cells.
Figure 5
Figure 5. FGFR2c expression and signaling modulate epithelial and mesenchymal markers
(a, b) HaCaT FGFR2b and HaCaT FGFR2c cells (a) as well as HKs FGFR2b and HKs FGFR2c (b) were grown in complete medium. Double immunofluorescence using anti-Bek polyclonal antibodies and anti-E-cadherin, anti-vimentin or anti-α-SMA monoclonal antibodies shows that, only in FGFR2c positive cells, the expression of E-cadherin is shut-down, while that of the two mesenchymal markers is slightly induced. Bar: 10 mm. (c) Transiently transfected cells were serum starved and stimulated with KGF or FGF2 for 24 h in presence or not of SU5402. Immunofluorescence performed as above reveals that the E-cadherin staining disappears in FGFR2c positive cells only upon FGF2 stimulation, but it is conserved when treatment is done in the presence of SU5402. E-cadherin signal is instead conserved on the plasma membranes of all FGFR2b positive cells; upon KGF stimulation the staining is visible in cell-cell contact sides (arrowhead), but it is lost at the leading edge (arrows). Bar: 10 mm. (d) Western blot analysis performed in stably transduced cells stimulated with growth factors as above, shows a reduction of E-cadherin band and the appearance of that corresponding to vimentin in pBp-FGFR2c cells only upon FGF2 stimulation. This opposite trend is abolished by SU5402. HFs were used as control. The equal loading was assessed using anti-b actin antibody. For densitometric analysis results are expressed as mean values from three independent experiments.
Figure 6
Figure 6. FGFR2c expression and signaling unbalance the transcription factors involved in EMT and their related miRs
(a-d) Real-time RT-PCR analysis of the expression profile of ZEB1, Snail1 and related miRs performed in stably transduced cells grown in complete medium. The up-regulation of ZEB1 and Snail1 mRNAs correspond to a down-regulation of all miR-200 family members and miR-203 in FGFR2c expressing cells; no changes in the expression of transcription factor mRNAs or miRs are detected in FGFR2b overexpressing cells. (e) Stably transduced cells were transfected with small interfering RNA for FGFR2/Bek (FGFR2 siRNA), to obtain receptor silencing, or with an unrelated siRNA used as control. FGFR2 depletion abolishes Snail1 induction in pBp-FGFR2c cells, but enhances its expression in pBp-FGFR2b cells. (f) Stably transduced cells were serum starved and stimulated with growth factors as above; Snail1 mRNA expression is increased in FGFR2c expressing cells only after FGF2 stimulation. In unstimulated conditions, a significant reduction of Snail1 expression is evident in pBp-FGFR2b compared to control cells. (g-k) Real-time RT-PCR analysis of the expression profile of FGFR2b, FGFR2c, ZEB1 and Snail1 in HKs transiently transfected or co-transfected with the reported vectors and siRNAs. Primary cultured HFs and HaCaT pCI-neo were used as control. While FGFR2b overexpression does not appear to affect ZEB1 and Snail1 mRNA expression, their increase is evident either upon expression of FGFR2c or silencing of FGFR2 (g h) FGFR2b siRNA, which specifically down-regulates FGFR2b mRNA in cells endogenously-expressing or overexpressing the FGFR2b epithelial isoform (i) and does not interfere with FGFR2c expression (i) significantly increases both ZEB1 and Snail1 expression in HKs transfected with the empty vector as well as in those transfected with FGFR2b or FGFR2c (j, k). Results are expressed as mean value ± SE. Student's t test was performed as reported in materials and methods and significance level has been defined as follows: (a) NS and * p < 0.05 vs pBp cells; (b) NS and * p < 0.01 vs pBp cells; (c, d) NS and * p < 0.05 vs pBp cells; (e) ^ p < 0.01, ^^^ p < 0.05 and NS vs the corresponding control siRNA cells; ^^ p < 0.05 vs pBp cells; (f) NS and ^^ p < 0.05 vs the corresponding untreated cells; ^ p < 0.05 vs pBp cells. (g, h) NS, * p < 0.001, ** p < 0.005 and *** p < 0.05 vs HKs pCI-neo control siRNA; **** p < 0.05 vs HKs pCI-neo FGFR2 siRNA; (j) NS and *** p < 0.05 vs HKs pCI-neo control siRNA; * p < 0.01 and ** p < 0.05 vs the corresponding control siRNA HKs; (k) * p < 0.05 and **** NS vs the corresponding control siRNA HKs, ** p < 0.01 and *** NS vs HKs pCI-neo control siRNA
Figure 7
Figure 7. FGFR2c expression and signaling impact on β4-integrin and N-cadherin expression pattern
HaCaT cells stably and transiently expressing the FGFR2 isoforms were stimulated with KGF and FGF2 in presence or not of SU5402 as reported above. (a) Western blot analysis shows that the band corresponding to β4-integrin is strongly attenuated only in HaCaT pBp-FGFR2c cells upon FGF2 stimulation, but it is conserved in the presence of SU5402. The equal loading was assessed using anti-b actin antibody. For densitometric analysis results are expressed as mean values from three independent experiments. (b) Double immunofluorescence analysis performed in transiently transfected cells shows that b4-integrin is uniformly distributed on the plasma membranes of all unstimulated cells, while its staining translocates at the leading edge of migrating FGFR2b cells upon KGF stimulation and it is lost in FGFR2c positive cells upon FGF2 stimulation. (c) Western blot analysis performed in cells stably expressing FGFR2 isoforms clearly shows that N-cadherin band appears only in FGF2-stimulated pBp-FGFR2c cells, but remains undetectable upon FGF2 stimulation in the presence of SU5402. The equal loading was assessed using anti-b actin antibody. For densitometric analysis results are expressed as mean values from three independent experiments.

Similar articles

Cited by

References

    1. Turner N, Grose R. Fibroblast growth factor signalling: from development to cancer. Nat Rev Cancer. 2010;10:116–129. - PubMed
    1. Goetz R, Mohammadi M. Exploring mechanisms of FGF signalling through the lens of structural biology. Nat Rev Mol Cell Biol. 2013;14:166–180. - PMC - PubMed
    1. Haugsten EM, Wiedlocha A, Olsnes S, Wesche J. Roles of fibroblast growth factor receptors in cancerogenesis. Mol Cancer Res. 2010;8:1439–1452. - PubMed
    1. Brooks AN, Kilgour E, Smith PD. Molecular pathways: fibroblast growth factor signaling: a new therapeutic opportunity in cancer. Clin Cancer Res. 2012;18:1855–1862. - PubMed
    1. Warzecha CC, Sato TK, Nabet B, Hogenesch JB, Carstens RP. ESRP1 and ESRP2 are epithelial cell-type-specific regulators of FGFR2 splicing. Mol Cell. 2009;33:591–601. - PMC - PubMed

Publication types

MeSH terms

Substances