. 2015 Dec 29;10(12):e0144650.
doi: 10.1371/journal.pone.0144650. eCollection 2015.

Periplasmic Acid Stress Increases Cell Division Asymmetry (Polar Aging) of Escherichia coli

Affiliations

Periplasmic Acid Stress Increases Cell Division Asymmetry (Polar Aging) of Escherichia coli

Michelle W Clark et al. PLoS One. .

Abstract

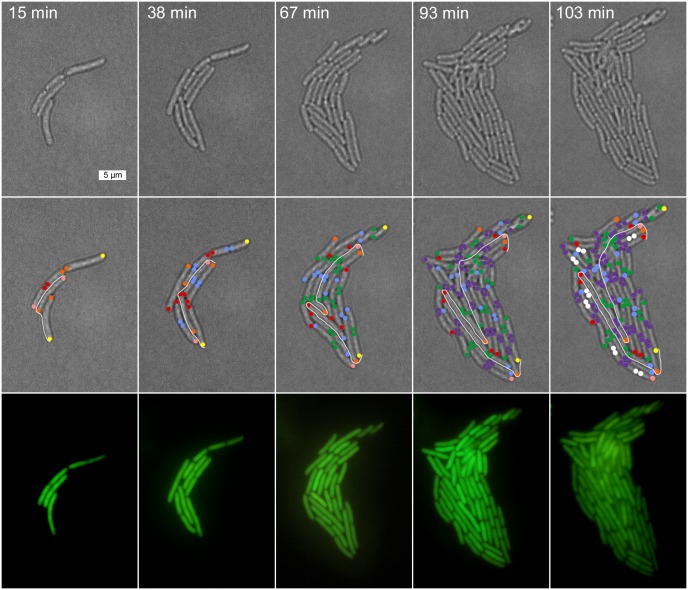
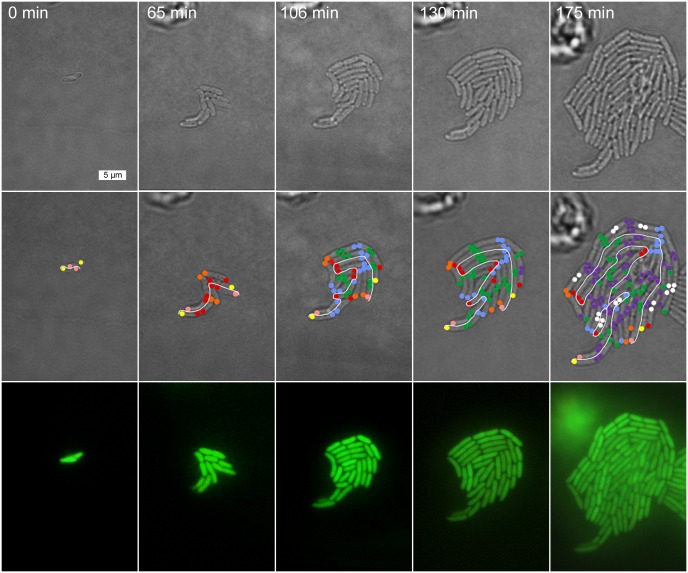
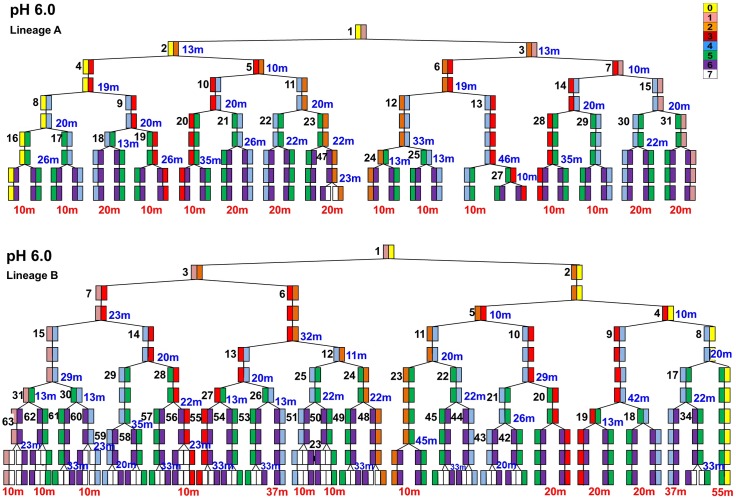
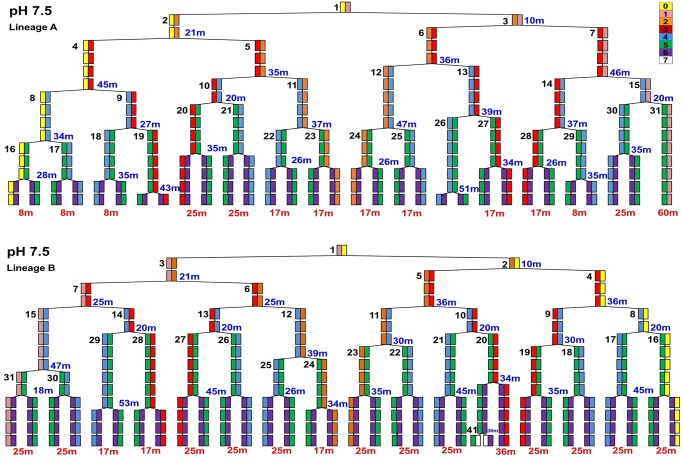
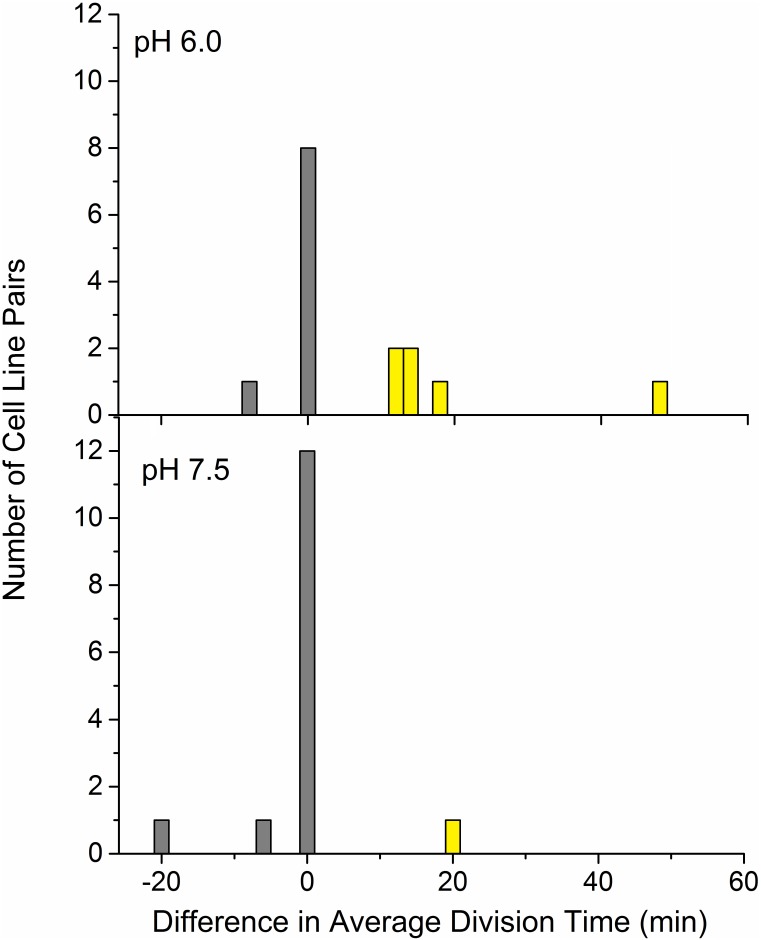
Under certain kinds of cytoplasmic stress, Escherichia coli selectively reproduce by distributing the newer cytoplasmic components to new-pole cells while sequestering older, damaged components in cells inheriting the old pole. This phenomenon is termed polar aging or cell division asymmetry. It is unknown whether cell division asymmetry can arise from a periplasmic stress, such as the stress of extracellular acid, which is mediated by the periplasm. We tested the effect of periplasmic acid stress on growth and division of adherent single cells. We tracked individual cell lineages over five or more generations, using fluorescence microscopy with ratiometric pHluorin to measure cytoplasmic pH. Adherent colonies were perfused continually with LBK medium buffered at pH 6.00 or at pH 7.50; the external pH determines periplasmic pH. In each experiment, cell lineages were mapped to correlate division time, pole age and cell generation number. In colonies perfused at pH 6.0, the cells inheriting the oldest pole divided significantly more slowly than the cells inheriting the newest pole. In colonies perfused at pH 7.50 (near or above cytoplasmic pH), no significant cell division asymmetry was observed. Under both conditions (periplasmic pH 6.0 or pH 7.5) the cells maintained cytoplasmic pH values at 7.2-7.3. No evidence of cytoplasmic protein aggregation was seen. Thus, periplasmic acid stress leads to cell division asymmetry with minimal cytoplasmic stress.


Conflict of interest statement

Competing Interests: The authors have declared that no competing interests exist.

Figures

Fig 1
Fig 1. Tracking of individual cells perfused at pH 6.0.
The panel above displays time-lapsed images captured during the tracking of cells in a colony for a representative experiment at pH 6.0. Cells are located manually within a field and then followed through six consecutive divisions. The first row of phase contrast images are the original images captured during the experiment. Color coded images below are the phase contrast images marked with relative pole ages (same color scale appearing in lineages). The bottom row of images are corresponding fluorescent images captured at the same time interval as phase contrast images. Scale bar = 5 μm. Time stamps indicate elapsed time from start of the experiment.
Fig 2
Fig 2. Tracking of individual cells perfused at pH 7.5.
The panel above displays time-lapsed images captured during the tracking of cells in a colony for a representative experiment at pH 7.5. Images were obtained and analyzed as in Fig 1.
Fig 3
Fig 3. Cell half-lineages A and B in colonies perfused at pH 6.0.
Half-lineages A and B each include six generations of cells dividing. Each box represents a single cell at that time point. Individual poles of the cell and their corresponding pole age are labeled according to the color scale in the upper right hand corner. Each cell in the half-lineage is given a distinct number (left of the box). Cell numbers are standardized across all lineages. Colors correspond to the relative polar ages of each cell. Time (min) at each box indicate the division time of that cell, the time from initial existence of the cell until the point where it divided into two daughter cells. Time (min) in red beneath the final division indicates the time the cell existed until the experiment was ended.
Fig 4
Fig 4. Cell half lineages A and B in colonies perfused at pH 7.5.
Half-lineages include six generations of cells dividing. Analysis was conducted as in Fig 3.
Fig 5
Fig 5. Differences in mean division rates of old-pole and new-pole cell lines.
The stacked histograms represent the differences in average division times (old-pole cell line minus new-pole cell line) for each half-lineage. Mean division times for the old-pole line and new-pole line were calculated for each lineage, resulting in replicate pairs. The distribution of these pairwise differences is non-normal (Anderson-Darling p-value < 0.005, indicating strong deviation from normality). Non-parametric tests were used including a Wilcoxon signed rank test and a resampling permutation test.

References

    1. Ackermann M, Chao L, Bergstrom CT, Doebeli M. On the evolutionary origin of aging. Aging cell. 2007;6(2):235–44. - PMC - PubMed
    1. Ackermann M. Bacteria as a new model system for aging studies: investigations using light microscopy. Biotechniques. 2008;44(4):564–7. 10.2144/000112829 - DOI - PubMed
    1. López-Otín C, Blasco MA, Partridge L, Serrano M, Kroemer G. The hallmarks of aging. Cell. 2013;153(6):1194–217. 10.1016/j.cell.2013.05.039 - DOI - PMC - PubMed
    1. Stewart EJ, Madden R, Paul G, Taddei F. Aging and death in an organism that reproduces by morphologically symmetric division. PLoS biology. 2005;3(2):e45 - PMC - PubMed
    1. Johnson LR, Mangel M. Life histories and the evolution of aging in bacteria and other single-celled organisms. Mech Ageing and Dev. 2006;127(10):786–93. - PubMed

Publication types

MeSH terms

Substances

LinkOut - more resources