. 2016 Mar;101(3):1044-54.
doi: 10.1210/jc.2015-2860. Epub 2015 Dec 29.

Evidence of β-Cell Dedifferentiation in Human Type 2 Diabetes

Affiliations

Evidence of β-Cell Dedifferentiation in Human Type 2 Diabetes

Francesca Cinti et al. J Clin Endocrinol Metab. 2016 Mar.

Abstract

Context: Diabetes is associated with a deficit of insulin-producing β-cells. Animal studies show that β-cells become dedifferentiated in diabetes, reverting to a progenitor-like stage, and partly converting to other endocrine cell types.

Objective: To determine whether similar processes occur in human type 2 diabetes, we surveyed pancreatic islets from 15 diabetic and 15 nondiabetic organ donors.

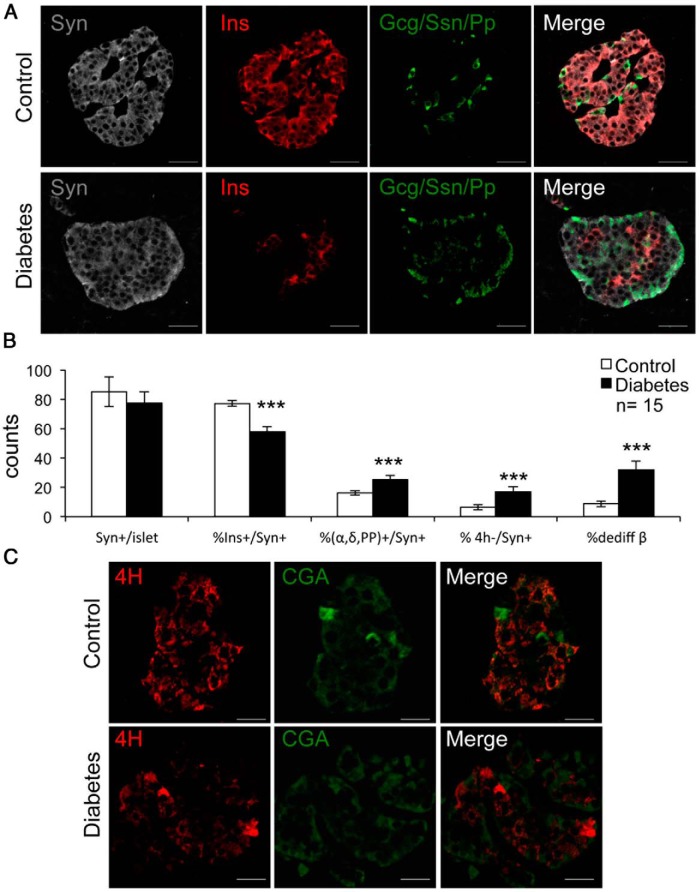
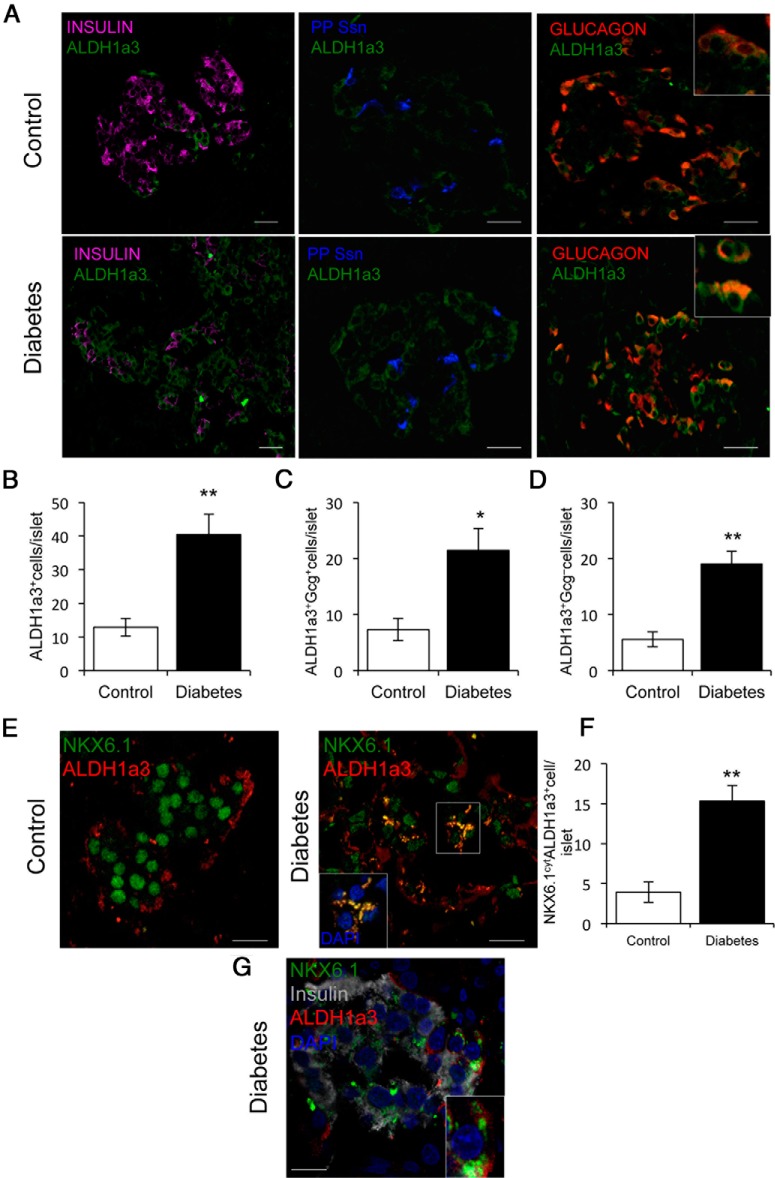
Design: We scored dedifferentiation using markers of endocrine lineage, β-cell-specific transcription factors, and a newly identified endocrine progenitor cell marker, aldehyde dehydrogenase 1A3.

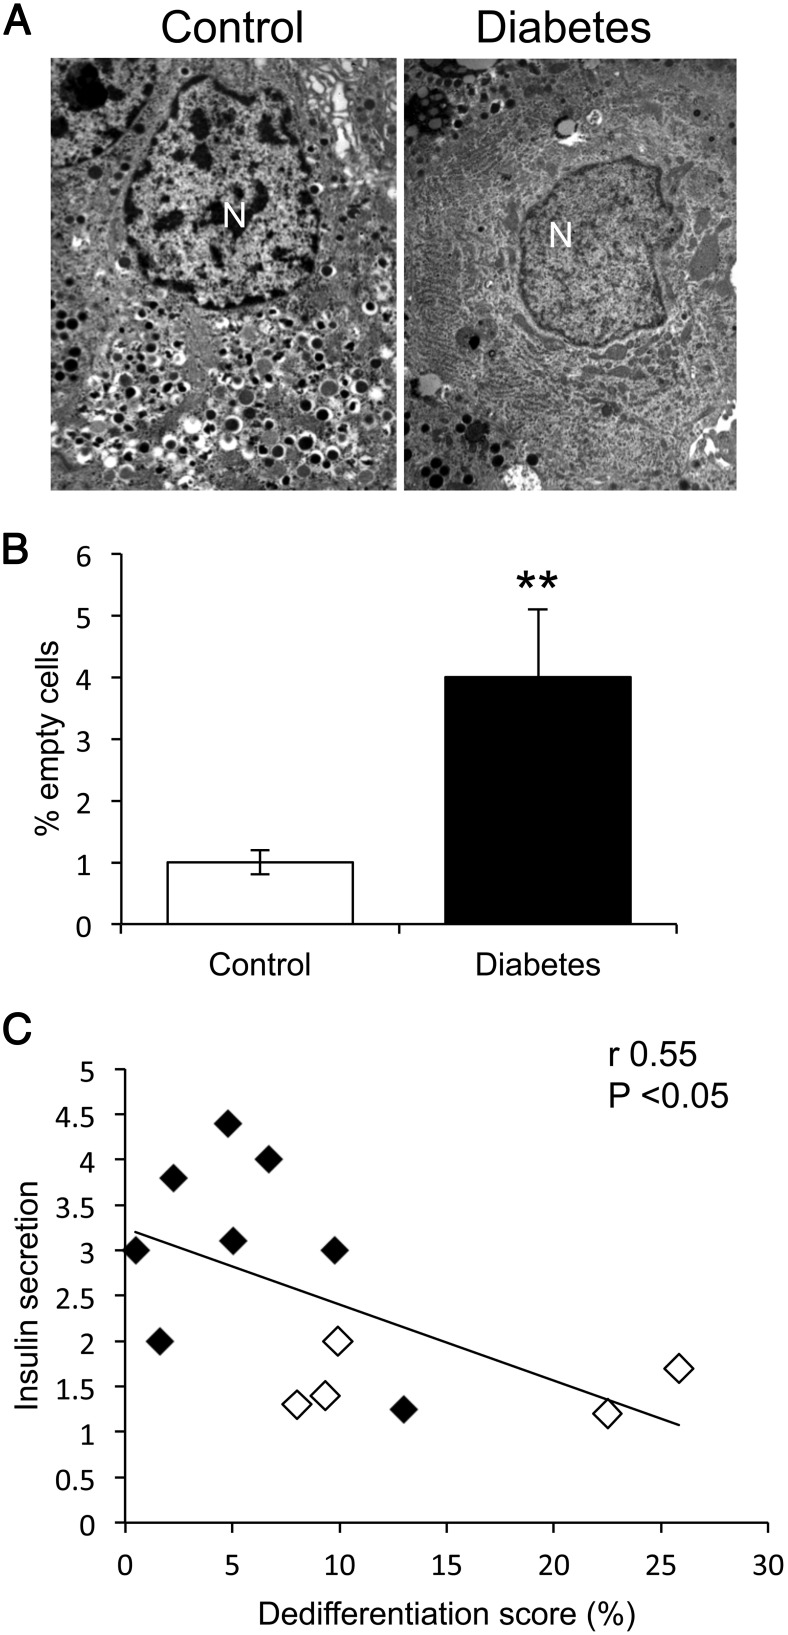
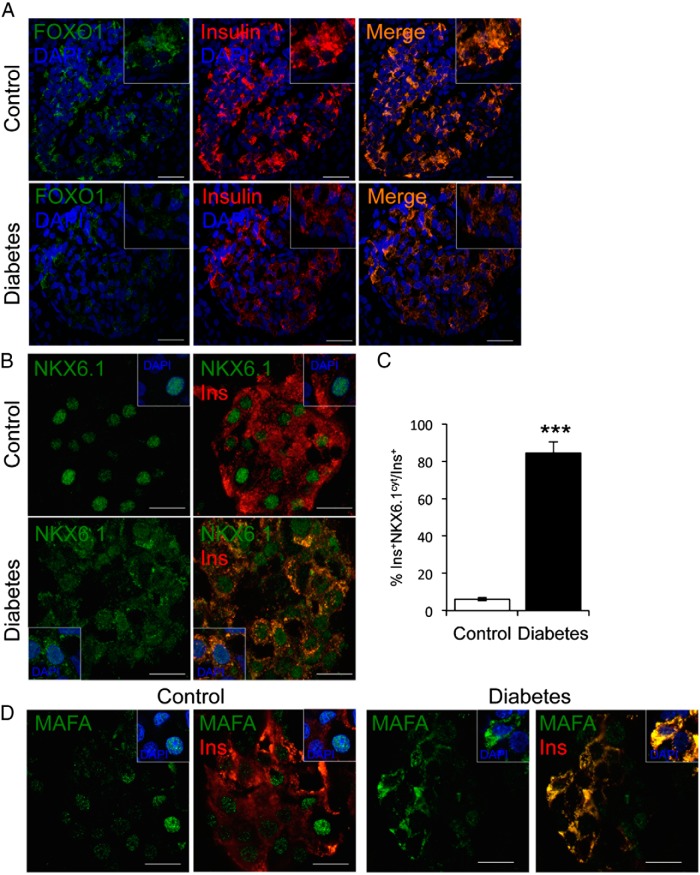
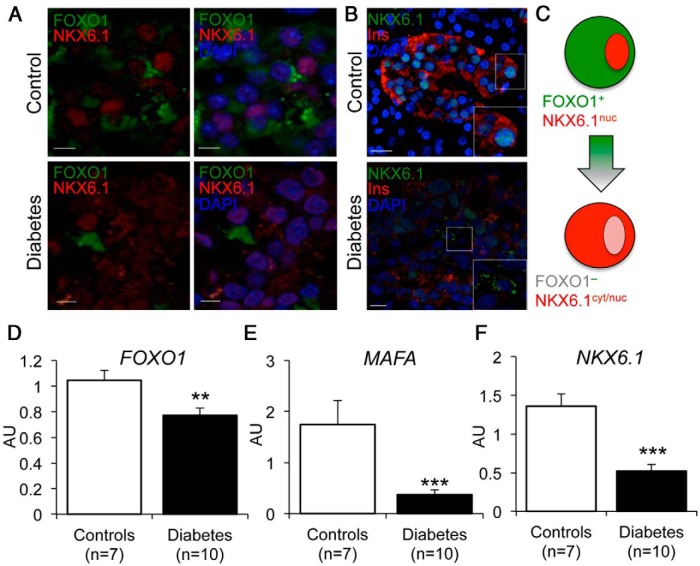
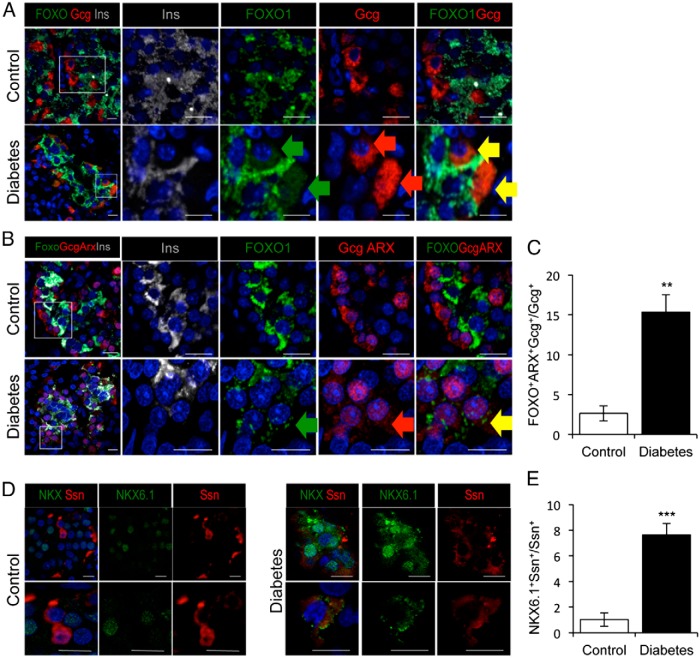
Results: By these criteria, dedifferentiated cells accounted for 31.9% of β-cells in type 2 diabetics vs 8.7% in controls, and for 16.8% vs 6.5% of all endocrine cells (P < .001). The number of aldehyde dehydrogenase 1A3-positive/hormone-negative cells was 3-fold higher in diabetics compared with controls. Moreover, β-cell-specific transcription factors were ectopically found in glucagon- and somatostatin-producing cells of diabetic subjects.

Conclusions: The data support the view that pancreatic β-cells become dedifferentiated and convert to α- and δ-"like" cells in human type 2 diabetes. The findings should prompt a reassessment of goals in the prevention and treatment of β-cell dysfunction.


Figures

Figure 1.
Figure 1.
Representative images of dedifferentiated β-cells. A, Immunofluorescent histochemistry on pancreatic section using insulin (Ins) (red), combined Gcg, Ssn, PP (green), and Syn (gray). B, Quantitative analysis of the data in A. C, Immunofluorescent histochemistry with the 4-hormone cocktail (4H) (red) and chromogranin A (CGA) (green). Data in B are mean ± SEM. ***, P < .001 by Student's t test. Scale bars, 20 μm; n = 15 for each group.
Figure 2.
Figure 2.
EM and correlation of insulin secretion with dedifferentiation. A, Representative images of healthy and degranulated cells. B, Quantitative analysis of EM findings. Data are mean ± SEM. **, P < .01 by Student's t test. N, nucleus. C, We plotted linear correlation analyses (Spearman's r) between the dedifferentiation score, calculated as % ratio of SYN+4H/SYN+ cells, and glucose-induced insulin secretion in isolated islets obtained from 13 donors. Controls are denoted by filled symbols, persons with diabetes by open circles.
Figure 3.
Figure 3.
Transcription factor analysis in pancreatic islets. A, Immunofluorescence on fresh-frozen pancreatic sections with FOXO1 (green), insulin (red), and DAPI (blue). B, Immunofluorescence with NKX6.1 (green), insulin (red), and DAPI (blue). C, Quantitative analysis of the data, shown as mean ± SEM. D, Immunofluorescence with MAFA (green), insulin (red), and DAPI (blue). Insets show representative cells. ***, P < .001 by Student's t test. Scale bars, 20 μm (A) and 10 μm (B and D); n = 5 for each group.
Figure 4.
Figure 4.
Altered localization and expression of FOXO1 and NKX6.1 in dedifferentiating β-cells. A, Immunofluorescence of pancreatic islets with FOXO1 (green), NKX6.1 (red), and DAPI (blue). Scale bars, 5 μm. B, Immunofluorescence of pancreatic islets with NKX6.1 (green), insulin (red), and DAPI (blue). Scale bars, 10 μm. C, Proposed model of dedifferentiating β-cells. D–F, qRT-PCR analysis of FOXO1 (D), MAFA (E), and NKX6.1 (F) in isolated human islets. Data are shown as mean ± SEM. **, P < .01; ***, P < .001 by Student's t test (n = 7 for controls, n = 10 diabetes).
Figure 5.
Figure 5.
ALDH1A3 localization in human islets. A, Immunofluorescence of ALDH1a3 (green) with insulin (magenta), combined Ssn and PP (blue), and Gcg (red). Scale bars, 20 μm. B–D, Quantitative analysis of the data shown as mean ± SEM. *, P = .05; **, P < .01 by Student's t test; n = 5 for each group. E, ALDH1A3 (red) colocalization with cytoplasmic NKX6.1 (green). Scale bars, 10 μm. F, Quantitative analysis of the data expressed as mean ± SEM. **, P < .01 by Student's t test; n = 5 for each group. G, Immunofluorescence of ALDH1a3 (red) with insulin (gray), NKX6.1 (green), and DAPI (blue). Inset shows ALDH1a3 colocalization with NKX6.1 in insulin negative cell. Scale bar, 10 μm.
Figure 6.
Figure 6.
Evidence of β-cell conversion to non-β-cells. A, Mislocalization of FOXO1 (green) to Gcg-immunoreactive cells (red). B, Mislocalization of FOXO1 (green) to ARX- and Gcg-immunoreactive cells (red). C, Quantitative analysis of triple positive (FOXO1, ARX, and Gcg) cells, as determined by the assay in C. D, Mislocalization of NKX6.1 (green) to Ssn-immunoreactive cells (red). E, Quantitative analysis of double positive (NKX6.1 and Ssn) cells. Insulin immunofluorescence is shown in gray (A and B). Scale bars, 10 μm (A, B, and D). In all panels, nuclei are counterstained with DAPI (blue). Green, red, and yellow arrows in panel indicate FOXO1+GCG+ cells (A) and FOXO1+GCG+Arx+ (B). C and E, Data as mean ± SEM. *, P = .05; **, P < .01; ***, P < .001 by Student's t test; n = 5 for each group.

References

    1. Ferrannini E. The stunned β cell: a brief history. Cell Metab. 2010;11:349–352. - PubMed
    1. Defronzo RA, Tripathy D, Schwenke DC, et al. Prevention of diabetes with pioglitazone in ACT NOW: physiologic correlates. Diabetes. 2013;62:3920–3926. - PMC - PubMed
    1. Weyer C, Bogardus C, Mott DM, Pratley RE. The natural history of insulin secretory dysfunction and insulin resistance in the pathogenesis of type 2 diabetes mellitus. J Clin Invest. 1999;104:787–794. - PMC - PubMed
    1. Levy J, Atkinson AB, Bell PM, McCance DR, Hadden DR. β-Cell deterioration determines the onset and rate of progression of secondary dietary failure in type 2 diabetes mellitus: the 10-year follow-up of the Belfast Diet Study. Diabet Med. 1998;15:290–296. - PubMed
    1. Savage PJ, Bennion LJ, Flock EV, et al. Diet-induced improvement of abnormalities in insulin and glucagon secretion and in insulin receptor binding in diabetes mellitus. J Clin Endocrinol Metab. 1979;48:999–1007. - PubMed

Publication types

MeSH terms