. 2015 Dec 29;13(12):e1002328.
doi: 10.1371/journal.pbio.1002328. eCollection 2015 Dec.

The Contribution of Network Organization and Integration to the Development of Cognitive Control

Affiliations

The Contribution of Network Organization and Integration to the Development of Cognitive Control

Scott Marek et al. PLoS Biol. .

Abstract

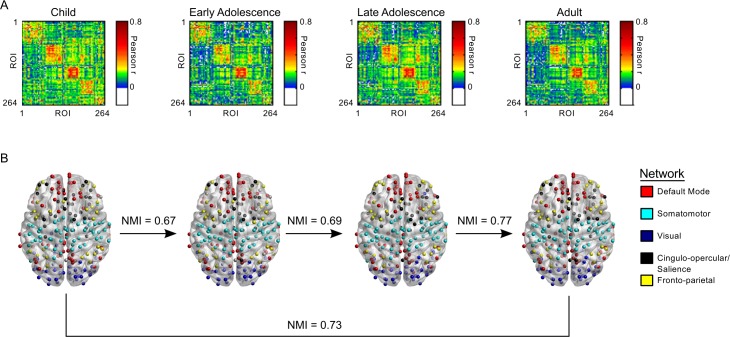
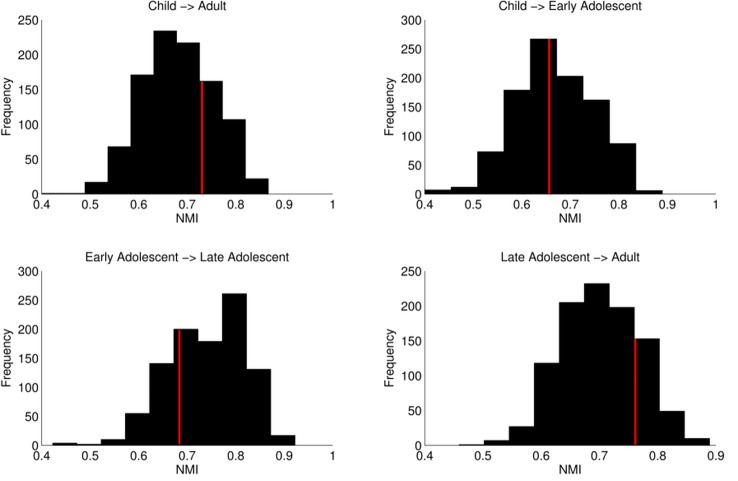
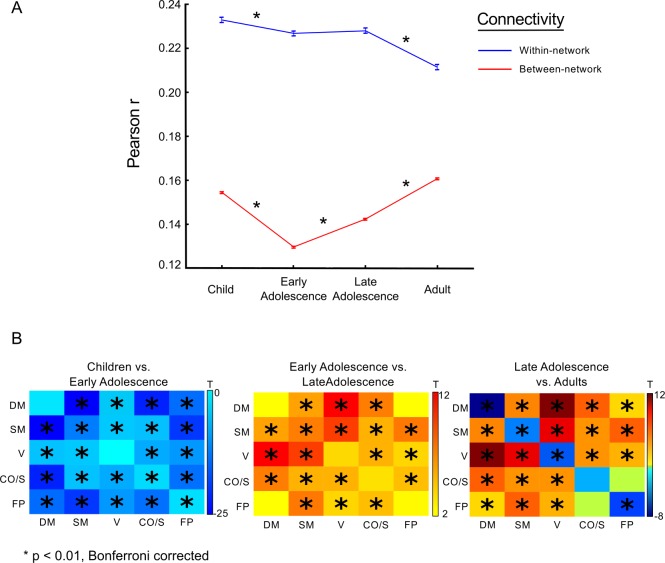
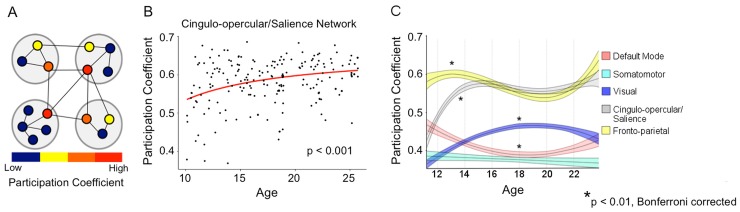
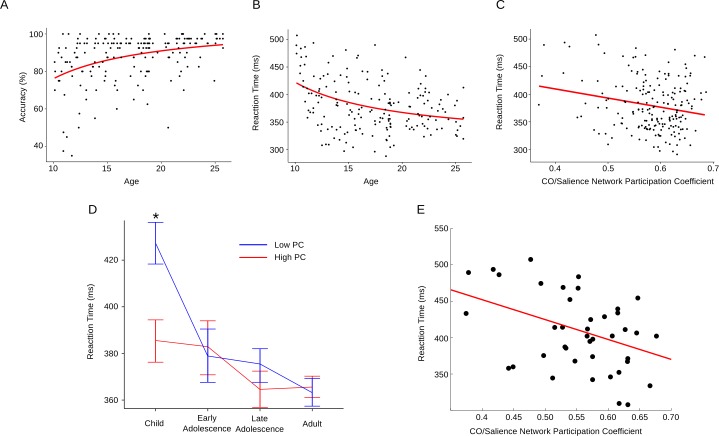
Cognitive control, which continues to mature throughout adolescence, is supported by the ability for well-defined organized brain networks to flexibly integrate information. However, the development of intrinsic brain network organization and its relationship to observed improvements in cognitive control are not well understood. In the present study, we used resting state functional magnetic resonance imaging (RS-fMRI), graph theory, the antisaccade task, and rigorous head motion control to characterize and relate developmental changes in network organization, connectivity strength, and integration to inhibitory control development. Subjects were 192 10-26-y-olds who were imaged during 5 min of rest. In contrast to initial studies, our results indicate that network organization is stable throughout adolescence. However, cross-network integration, predominantly of the cingulo-opercular/salience network, increased with age. Importantly, this increased integration of the cingulo-opercular/salience network significantly moderated the robust effect of age on the latency to initiate a correct inhibitory control response. These results provide compelling evidence that the transition to adult-level inhibitory control is dependent upon the refinement and strengthening of integration between specialized networks. Our findings support a novel, two-stage model of neural development, in which networks stabilize prior to adolescence and subsequently increase their integration to support the cross-domain incorporation of information processing critical for mature cognitive control.


Conflict of interest statement

The authors have declared that no competing interests exist.

Figures

Fig 1
Fig 1. Network organization is stable prior to the onset of adolescence.
(A) Group-averaged correlation matrices organized according to network affiliation. ROI order is consistent across all four groups. (B) Regions of interest imposed on a semitransparent brain. Normalized mutual information (NMI) is a measure of similarity between two sets of data. Here, NMI refers to the comparison between two sets of network affiliation vectors between each consecutive age group and between children and adults. (Data available at http://devrsfmri_2015.projects.nitrc.org/devrsfmri_2015.tar.bz2.)
Fig 2
Fig 2. Comparison of observed NMI to a null distribution.
Red lines denote the observed value for NMI. This value was plotted against a null distribution for each subsequent age group comparison and between children and adults. For each comparison, observed values fell maximally just over one standard deviation from the mean of the null distribution. Importantly, this effect was not restricted to the network density represented here (see S1 Table). (Data available at http://devrsfmri_2015.projects.nitrc.org/devrsfmri_2015.tar.bz2.)
Fig 3
Fig 3. Connectivity strength changes through development as a function of network organization.
(A) Connectivity strength changes as a function of within- and between-network connectivity. Asterisks denote significant differences between groups (p < 0.05, corrected) (B) Each cell represents the t-statistic resulting from a t test of connectivity strength between each network contrast. The diagonal represents within-network comparisons (e.g., DM-DM network connectivity strength differences between groups), while off-diagonal elements are between-network comparisons (e.g., DM network and CO/Salience network). Therefore, matrices are symmetric. Asterisks denote significant differences between groups (p < 0.01, corrected). (Data available at http://devrsfmri_2015.projects.nitrc.org/devrsfmri_2015.tar.bz2.)
Fig 4
Fig 4. Developmental changes in connectivity strength are not a function of distance.
(A) Distance distributions of significantly increasing connections (blue) and significantly decreasing connections (red) between the child and adult group. No significant difference was found between the two distributions, indicating a lack of evidence for distance-dependent effects on change in connectivity strength (p = 0.33). (B) Each point represents a pairwise relationship between two regions of interest. Data values represent the difference found by subtracting the averaged child matrix from the averaged adult matrix, plotted as a function of the Euclidean distance between regions of interest. No significant relationship was found between changes in correlation strength and distance (p > 0.05). (Data available at http://devrsfmri_2015.projects.nitrc.org/devrsfmri_2015.tar.bz2.)
Fig 5
Fig 5. Development of network integration.
(A) Model network with four communities (larger gray circles) to illustrate PC. Nodes (smaller colored circles) that are warmer colors have a larger PC due to the existence of distributed links to other networks, representing network integration. (B) The CO/Salience network significantly increased in PC, and thus integration, through adolescence (p < 0.001). No other network demonstrated any significant relationship with age in individual subjects (p > 0.05). (C) Development of long-term fluctuations in participation coefficient by network after smoothing data. The centerline of each curve represents the mean. Upper and lower bounds represent the 95% confidence interval. Asterisks denote statistically significant results from the regression analysis. (Data available from sheet “Fig5Fig6” in S1 Data.)
Fig 6
Fig 6. Relationship between increased cingulo-opercular/salience network integration and cognitive control.
Performance on the antisaccade task improves throughout adolescence, evidenced by increased accuracy (A) and decreased reaction time (B). As integration of the CO/Salience network increases, reaction time significantly decreases (C). (D) Results from the moderation analysis. CO/Salience integration significantly moderated the effect between age and antisaccade reaction time, such that less CO/Salience integration was predictive of longer reaction times, while higher CO/Salience integration led to significantly faster reaction times (p < 0.001). Note that this effect only occurred during late childhood, indicating that earlier maturation of the CO/Salience network is critical for achieving adult-like behavior earlier in development. (E) Reaction time as a function of CO/Salience network integration in the child group. (Data available from sheet “Fig5Fig6” in S1 Data.)
Fig 7
Fig 7. Regional increases in participation coefficient.
Node color represents network affiliation as defined in Fig 1. In the transition from childhood to adolescence, most regional increases were localized to the CO/Salience network, corroborating network-level findings. During adolescence, regional increases were mostly within the SM network, while regions within the DM network and FP network increased in integration from late adolescence into early adulthood. (Data available at http://devrsfmri_2015.projects.nitrc.org/devrsfmri_2015.tar.bz2.)

References

    1. Luna B, Marek S, Larsen B, Tervo-Clemmens B, Chahal R. An Integrative Model of the Maturation of Cognitive Control. Annu Rev Neurosci. 2015;38: 151–170. 10.1146/annurev-neuro-071714-034054 - DOI - PMC - PubMed
    1. Badre D. Defining an ontology of cognitive control requires attention to component interactions. Top Cogn Sci. 2011;3: 217–221. 10.1111/j.1756-8765.2011.01141.x - DOI - PMC - PubMed
    1. Lenartowicz A, Kalar DJ, Congdon E, Poldrack RA. Towards an Ontology of Cognitive Control. Top Cogn Sci. 2010;2: 678–692. 10.1111/j.1756-8765.2010.01100.x - DOI - PubMed
    1. Cole MW, Reynolds JR, Power JD, Repovs G, Anticevic A, Braver TS. Multi-task connectivity reveals flexible hubs for adaptive task control. Nat Neurosci. 2013;16: 1348–1355. 10.1038/nn.3470 - DOI - PMC - PubMed
    1. Diamond A. Developmental time course in human infants and infant monkeys, and the neural bases of, inhibitory control in reaching The development and neural bases of higher cognitive functions. New York: New York Academy of Science; 1990. pp. 637–676. - PubMed

Publication types

LinkOut - more resources