

Published Erratum
doi: 10.1371/journal.pbio.1002346.
eCollection 2015 Dec.
Correction: Sirt1 Regulates Insulin Secretion by Repressing UCP2 in Pancreatic β Cells
- PMID: 26714029
- PMCID: PMC4694709
- DOI: 10.1371/journal.pbio.1002346
Item in Clipboard
Published Erratum
Correction: Sirt1 Regulates Insulin Secretion by Repressing UCP2 in Pancreatic β Cells
PLoS Biol.
.
No abstract available
Figures
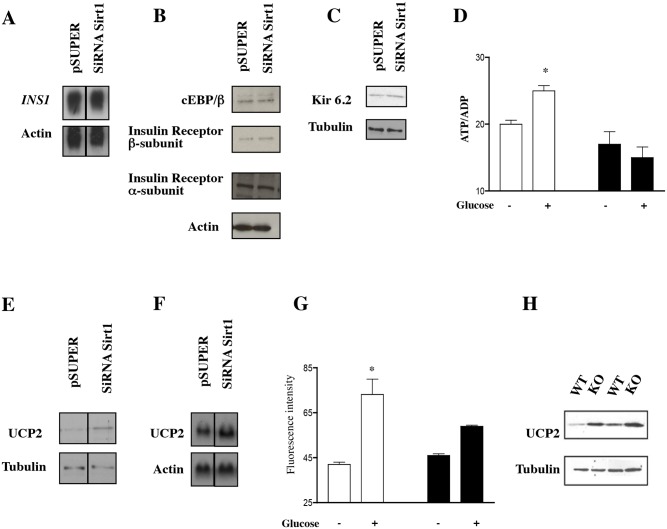
(A) Northern blot for the insulin gene INS-1 in cells with a control vector (pSUPER) or a SiRNA-Sirt1 vector (SiRNA Sirt1). Vertical lines indicate where the respective original blots were spliced together. (B and C) Western blot analyses of targets involved in insulin synthesis and secretion using specific antibodies: cEBP/β, insulin receptor α and β, and kir6.2, one of the K+channel receptor subunits. (D) Measurement of ATP/ADP levels in INS-1 control cells (open bars) or Sirt1 knockdown cells (black bars) treated with 16.7 mM glucose (+) or 4 mM glucose (−) (n = 3 experiments done in triplicate, *p < 0.005 in the pSUPER experiment; ANOVA). (E) Western blot analysis for UCP2 in INS-1 control cells (pSUPER) or knockdown cells (SiRNA Sirt1). Vertical lines indicate where the respective original blots were spliced together. (F) Northern blot analysis for UCP2 in INS-1 control cells (pSUPER) or knockdown cells (SiRNA Sirt1). Vertical lines indicate where the respective original blots were spliced together. (G) NADH levels in INS-1 cells after glucose addition as determined by autofluorescence [46] and expressed as arbitrary units. Cells stably transfected with control or Sirt1 SiRNA vectors were used (n = 2, *p < 0.05 compared with no glucose). (H) UCP2 protein levels in isolated pancreatic islets of two wild-type or two Sirt1 KO mice. Tubulin or actin was used as loading control in all Western and Northern blots.
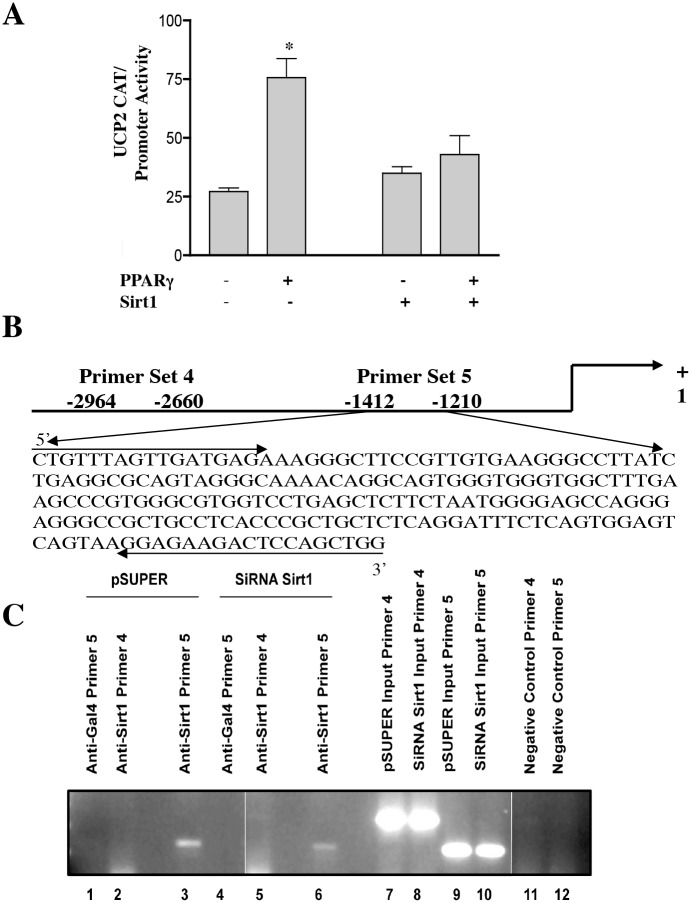
(A) In vitro CAT assay. 293T cells were transfected with a CAT reporter driven by the UCP2 promoter. Cells were also co-transfected with Sirt1 or not and with PPARγ or not, as indicated. CAT activity was determined (n = 3 experiments done in triplicate, *p < 0.05 in the no Sirt1 transfection experiment, ANOVA). (B) Schematic representation of the primer sets (arrows) in the UCP2 promoter (shown schematically and with excerpted DNA sequence). (C) Chromatin-immunoprecipitation (IP) was carried out on INS-1 control cells (lanes 1–3) or Sirt1 knockdown cells (columns 4–6) using Sirt1 antibody or a Gal4 control antibody, as indicated. PCR was carried out with the indicated primers. INPUT (columns 7–10) refers to PCR carried out on samples prepared prior to immunoprecipitation. Negative controls for the PCR (minus DNA) are also indicated (columns 11 and 12). In preparing the original panel for publication, the shadow/midtone/highlight input levels in the gray channel were adjusted uniformly to approximately 35/1.00/85 units. Vertical lines indicate where the original gel image was spliced together.
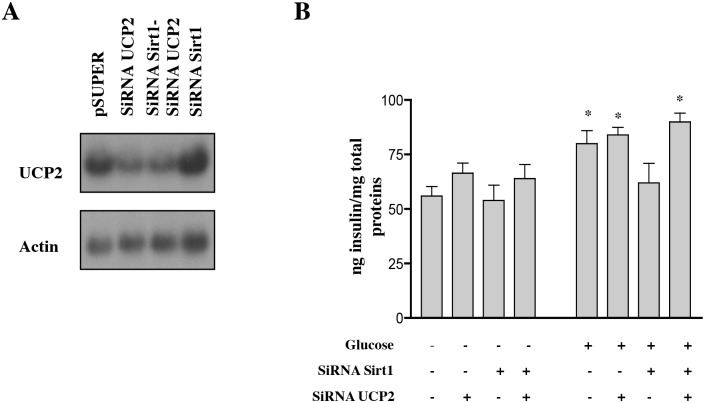
(A) Northern blot for UCP2 RNA in control INS-1 cells, and cells knocked down for Sirt1 (SiRNA Sirt1), UCP2 (SiRNA UCP2), or both Sirt1 and UCP2 (SiRNA Sirt1-SiRNA UCP2). (B) Insulin secretion in INS-1 control cells and cells with knockdown levels of Sirt1, UCP2, or both Sirt1 and UCP2 after treatment with 16.7 mM glucose (+) or 4mM glucose (−) for 1 h (n = 3 experiments done in triplicate, *p < 0.05 compared to no glucose, ANOVA).
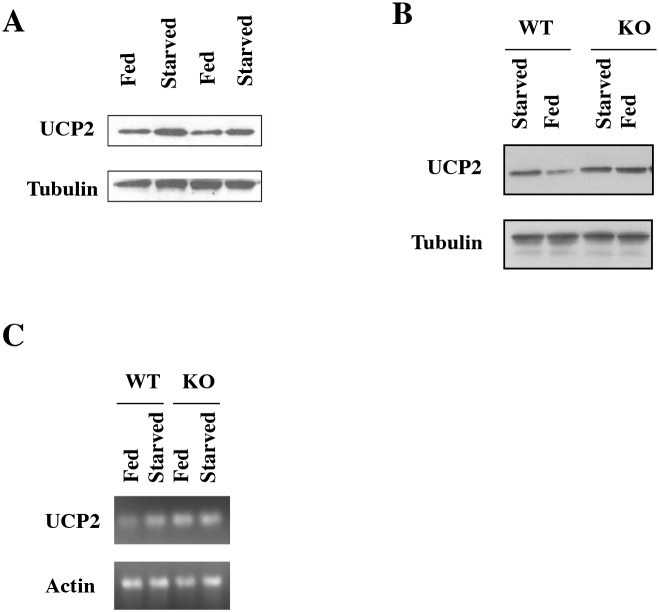
Western blot for UCP2 in isolated islets in two ad libitum and two starved mice. (B) Western blot for UCP2 in wild-type (WT) or Sirt1 KO littermates either fed ad libitum or starved for 18 h. The experiment shown is representative of four pairs of wild-type and KO littermates analyzed. (C) RT-PCR for UCP2 in wild-type or Sirt1 KO mice fed or starved.
Erratum for
-
Sirt1 regulates insulin secretion by repressing UCP2 in pancreatic beta cells.PLoS Biol. 2006 Feb;4(2):e31. doi: 10.1371/journal.pbio.0040031. Epub 2005 Dec 27. PLoS Biol. 2006. PMID: 16366736 Free PMC article.
References
-
- Bordone L, Motta MC, Picard F, Robinson A, Jhala US, Apfeld J, et al. (2006) Sirt1 Regulates Insulin Secretion by Repressing UCP2 in Pancreatic β Cells. PLoS Biol 4(2): e31 doi: 10.1371/journal.pbio.0040031 - DOI - PMC - PubMed
Publication types
Grants and funding
LinkOut - more resources
Full Text Sources
Other Literature Sources
