. 2016 Feb:91:42-51.
doi: 10.1016/j.yjmcc.2015.12.013. Epub 2015 Dec 20.

Novel insights on the relationship between T-tubular defects and contractile dysfunction in a mouse model of hypertrophic cardiomyopathy

Affiliations

Novel insights on the relationship between T-tubular defects and contractile dysfunction in a mouse model of hypertrophic cardiomyopathy

C Crocini et al. J Mol Cell Cardiol. 2016 Feb.

Abstract

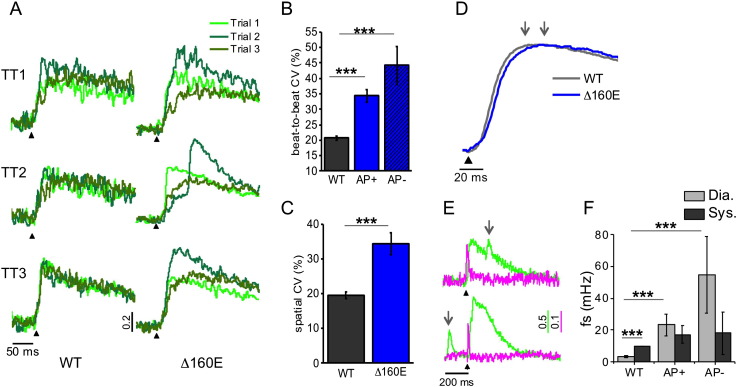
Abnormalities of cardiomyocyte Ca(2+) homeostasis and excitation-contraction (E-C) coupling are early events in the pathogenesis of hypertrophic cardiomyopathy (HCM) and concomitant determinants of the diastolic dysfunction and arrhythmias typical of the disease. T-tubule remodelling has been reported to occur in HCM but little is known about its role in the E-C coupling alterations of HCM. Here, the role of T-tubule remodelling in the electro-mechanical dysfunction associated to HCM is investigated in the Δ160E cTnT mouse model that expresses a clinically-relevant HCM mutation. Contractile function of intact ventricular trabeculae is assessed in Δ160E mice and wild-type siblings. As compared with wild-type, Δ160E trabeculae show prolonged kinetics of force development and relaxation, blunted force-frequency response with reduced active tension at high stimulation frequency, and increased occurrence of spontaneous contractions. Consistently, prolonged Ca(2+) transient in terms of rise and duration are also observed in Δ160E trabeculae and isolated cardiomyocytes. Confocal imaging in cells isolated from Δ160E mice reveals significant, though modest, remodelling of T-tubular architecture. A two-photon random access microscope is employed to dissect the spatio-temporal relationship between T-tubular electrical activity and local Ca(2+) release in isolated cardiomyocytes. In Δ160E cardiomyocytes, a significant number of T-tubules (>20%) fails to propagate action potentials, with consequent delay of local Ca(2+) release. At variance with wild-type, we also observe significantly increased variability of local Ca(2+) transient rise as well as higher Ca(2+)-spark frequency. Although T-tubule structural remodelling in Δ160E myocytes is modest, T-tubule functional defects determine non-homogeneous Ca(2+) release and delayed myofilament activation that significantly contribute to mechanical dysfunction.

Keywords: Excitation–contraction coupling; Hypertrophic cardiomyopathy; Imaging; Non-linear microscopy; T-tubules.


Figures

Fig. 1
Fig. 1
Steady-state interval-force relationship. (A) Representative twitch traces from WT (grey) and cTnT Δ160E (blue) ventricular trabeculae recorded at 0.2, 2 and 4 Hz stimulation frequencies. cTnT Δ160E trabeculae show prolonged contraction at every stimulation frequency when compared to WT. At 4 Hz, cTnT Δ160E trabeculae also show a reduced twitch tension amplitude compared to WT. (B) Curves showing time from stimulus to peak contraction (TTP, solid line) and time from peak to 50% relaxation (RT50, dashed line) in WT (grey) and cTnT Δ160E (blue) trabeculae. (C) Data depicting frequency-dependence of twitch amplitude in WT (grey) and cTnT Δ160E (blue) trabeculae. Data reported as mean ± SEM calculated from 16 WT trabeculae and 15 cTnT Δ160E (N = 12 WT and 10 cTnT Δ160E). (D) Representative 8% SDS-PAGE gel of myofibril suspensions from left and right ventricles of Δ160E and WT hearts. Control human atrial myofibrils are used for comparison to identify the position of the β-myosin band; only α-MHC is expressed in Δ160E and WT hearts. On the right, a quantification in percentage is reported (N = 5 WT, N = 4 cTnT Δ160E).
Fig. 2
Fig. 2
Short-term interval force relationship. (A) Examples of premature contractions in WT (grey) and cTnT Δ160E ventricular trabeculae (blue). An extra-stimulus at 400 ms is inserted into a sequence of steady-state stimuli at 1 Hz. The tension amplitude in the cTnT Δ160E trabecula is increased compared to the WT. (B) The amplitude of the premature contraction is quantified as a percentage of steady state 1 Hz twitches. Data reported as mean ± SEM calculated from 12 WT trabeculae and 10 cTnT Δ160E (N = 9 WT and 8 cTnT Δ160E). (C) Representative traces of post-rest potentiation protocols in WT (grey) and cTnT Δ160E (blue) ventricular trabeculae. In the experiments, resting intervals vary from 5 to 60 s. Here, representative traces for pauses of 10 s are reported. The cTnT Δ160E trabecula shows spontaneous contractions during the stimulation pause. (D) Frequency of spontaneous contractions during stimulation pauses. (E) Amplitude of post rest contractions (relative to 1 Hz twitches) at different resting intervals. Data calculated from 15 WT trabeculae and 10 cTnT Δ160E (N = 11 WT and 8 cTnT Δ160E). Students's t-test **p < 0.01 and ***p < 0.001.
Fig. 3
Fig. 3
Global calcium transients in cTnT Δ160E trabeculae and cardiomyocytes. (A) Representative global Ca2 + transients recorded from WT (grey) and cTnT Δ160E (blue) trabeculae, labelled with Fura-2 AM. In the panel below, time to peak (TTP), 50% (CaT50), and 90% (CaT90) decay of Ca2 + transients recorded in ventricular trabeculae (n = 6 from N = 3 WT and n = 5 from N = 3 cTnT Δ160E mice3 cTnT Δ160E mice). (B) Amplitude of Ca2 + transients and diastolic Ca2 + levels recorded in WT and cTnT Δ160E cells at 1 and 5 Hz. Below, graphs depicting the duration of Ca2 + transients at 1 and 5 Hz. (C) Representative examples of SR Ca2 + load assessed during rapid application of caffeine 20 mM and calculated from the amplitude of caffeine-induced Ca2 + transients at 1 Hz in WT and Δ160E cardiomyocytes (n = 49 cells of N = 5 WT and n = 37 cells of N = 4 cTnT Δ160E mice). Students's t-test *p < 0.05 and **p < 0.01.
Fig. 4
Fig. 4
TATS architecture and sarcomeric alignment. (A) Two representative confocal images of WT and cTnT Δ160E cardiomyocytes. Sarcolemma stained with di-4-AN(F)EPPTEA. In the bottom panels, correspondent images of same cells showing skeletonized T-tubular system, obtained with AUTO-TT. Transverse elements are shown in green and axial ones in magenta. On the right, columns showing the density of transverse and axial tubules, as well as TATS regularity in WT and cTnT Δ160E cardiomyocytes. Data reported as mean ± SEM calculated from 39 WT cells and 46 cTnT Δ160E. Students's t-test **p < 0.01 and ***p < 0.001. (B) Immunofluorescence analysis of sarcomeres and T-tubules in WT and cTnT Δ160E isolated cardiomyocytes. Cells are stained with anti-caveolin-3 (red) and anti-α-actinin (green) primary antibodies for labelling TATS and z-lines, respectively. The white inset is magnified in the right panel. Scale bars: 20 μm.
Fig. 5
Fig. 5
Defects of T-tubules electrical activity and local calcium release in cTnT Δ160E. (A) Left: two-photon fluorescence (TPF) image of a stained cTnT Δ160E ventricular myocyte: sarcolemma in magenta (di-4-AN(F)EPPTEA) and [Ca2 +]i in green (GFP-certified Fluoforte). Scale bar in white: 5 μm. Right: representative normalized fluorescence traces (ΔF/F0) of SS and two T-tubules (TTi) recorded in WT and cTnT Δ160E cardiomyocyte (average of ten subsequent trials). Membrane potential in magenta, [Ca2 +]i in green. AP elicited at 200 ms (black arrowheads). (B) Columns showing the percentage of electrically failing T-tubules in WT and cTnT Δ160E myocytes. Data from 101 WT and 66 cTnT Δ160E T-tubules (Students's t-test ***p < 0.001). (C) Superposition of fluorescence Ca2 + traces (ΔF/F0) of electrically coupled (AP +, dark green) and uncoupled (AP−, green) T-tubules reported in (A). The two grey arrows pinpoint Ca2 + transients TTP of the traces. Electrical trigger provided at 200 ms (black arrowhead). (D) Columns showing time-to-peak (TTP) mean values of Ca2 + release measured in cTnT Δ160E cells with respect to WT. Ca2 + transient kinetics is reported by separately analysing the two populations of T-tubules (AP + and AP −). Data reported as mean ± SEM from 101 WT T-tubules, 65 AP +, and 15 AP − (n = 28 WT and 17 cTnT Δ160E; N = 10 WT and 7 cTnT Δ160E). Students's t-test **p < 0.01, ***p < 0.001.
Fig. 6
Fig. 6
Variability of Ca2 + release and Ca2 + sparks. (A) Superposition of three subsequent Ca2 + transients recorded in three different T-tubules (TTi) of WT and cTnT Δ160E cardiomyocytes. (B-C) Graphs showing Ca2 + release coefficient of variability (CV) calculated at TTP based on time (beat-to-beat CV) and on space (spatial CV). Data from 28 WT cells and 17 cTnT Δ160E myocytes. AP + and AP − of cTnT Δ160E are separately analysed in beat-to-beat CV. (D) Average of Ca2 + transients recorded from 28 WT (grey) and 17 cTnT Δ160E (blue) cardiomyocytes. The two arrows pinpoint the TTP in the transients. (E) Two representative traces of Ca2 + sparks recorded in cTnT Δ160E cells either in diastole and systole, grey arrows pinpointing the Ca2 + spark occurrence. (F) Columns showing Ca2 + spontaneous sparks frequency (fs) recorded in 101 TTs of WT cells, 65 AP + and 15 AP − of cTnT Δ160E myocytes (Data shown as mean ± SEM, N = 10 WT and 7 cTnT Δ160E). Ca2 + sparks recorded during Ca2 + transient (CaT95) are considered systolic, while the others are diastolic. Student's t-test applied; **p < 0.01 ***p < 0.001.

References

    1. Ferrantini C., Crocini C., Coppini R., Vanzi F., Tesi C., Cerbai E. The transverse-axial tubular system of cardiomyocytes. Cell. Mol. Life Sci. 2013;70:4695–4710. - PMC - PubMed
    1. Brette F., Despa S., Bers D.M., Orchard C.H. Spatiotemporal characteristics of SR Ca(2 +) uptake and release in detubulated rat ventricular myocytes. J. Mol. Cell. Cardiol. 2005;39:804–812. - PubMed
    1. Ferrantini C., Coppini R., Sacconi L., Tosi B., Zhang M.L., Wang G.L. Impact of detubulation on force and kinetics of cardiac muscle contraction. J. Gen. Physiol. 2014;143:783–797. - PMC - PubMed
    1. Song L.S., Sobie E.A., McCulle S., Lederer W.J., Balke C.W., Cheng H. Orphaned ryanodine receptors in the failing heart. Proc. Natl. Acad. Sci. U. S. A. 2006;103:4305–4310. - PMC - PubMed
    1. Crocini C., Coppini R., Ferrantini C., Yan P., Loew L.M., Tesi C. Defects in T-tubular electrical activity underlie local alterations of calcium release in heart failure. Proc. Natl. Acad. Sci. U. S. A. 2014;111:15196–15201. - PMC - PubMed

Publication types

MeSH terms