. 2016 Apr 2;7(3):230-42.
doi: 10.1080/21505594.2015.1135287. Epub 2015 Dec 29.

Discovery of the gray phenotype and white-gray-opaque tristable phenotypic transitions in Candida dubliniensis

Affiliations

Discovery of the gray phenotype and white-gray-opaque tristable phenotypic transitions in Candida dubliniensis

Huizhen Yue et al. Virulence. .

Abstract

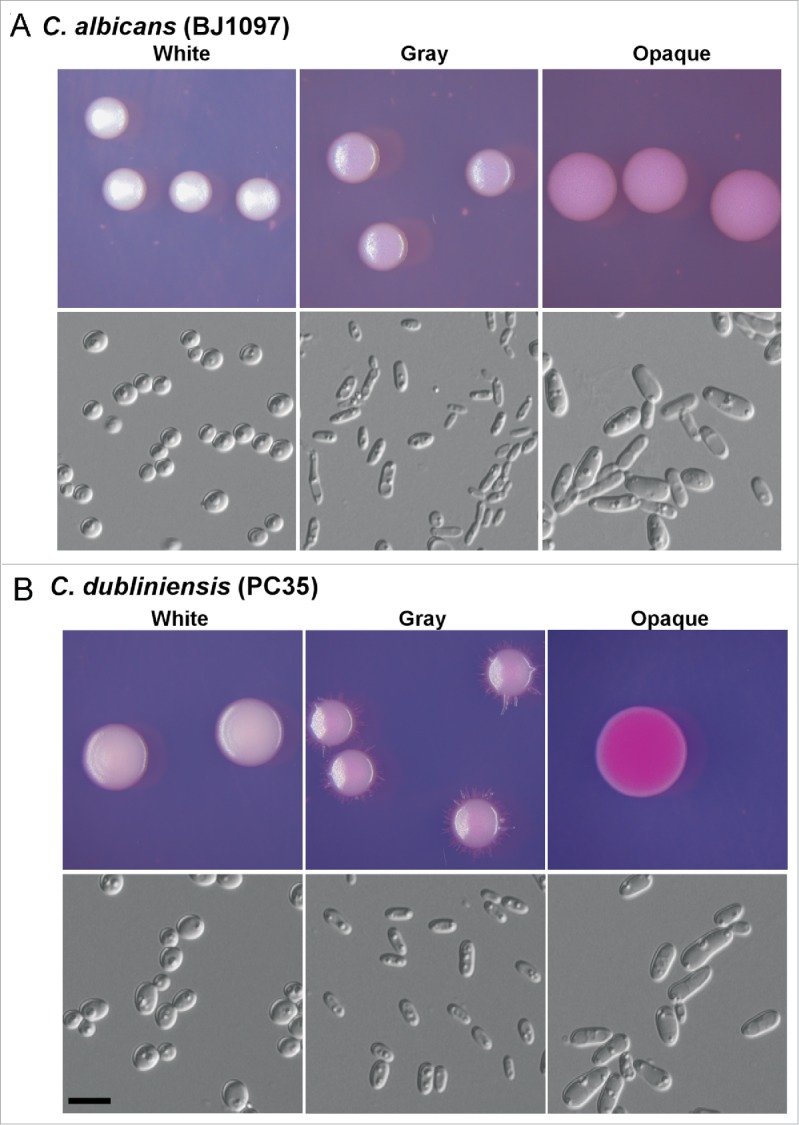
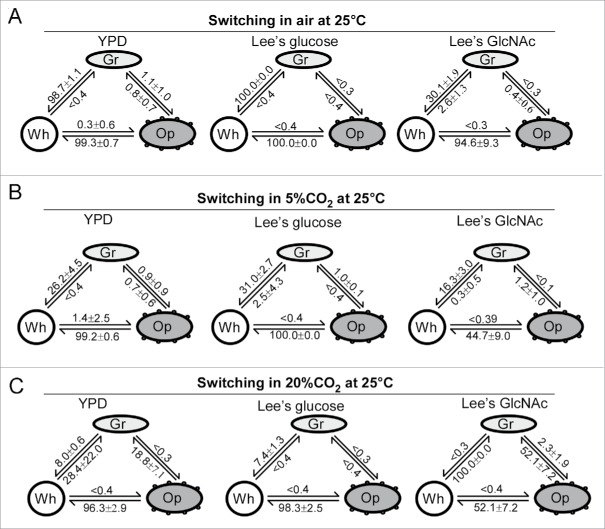
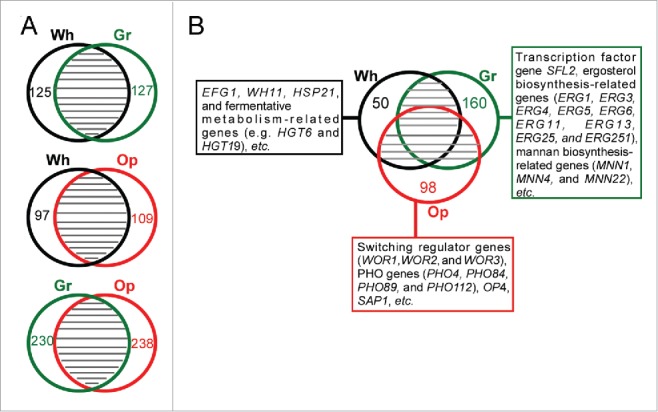
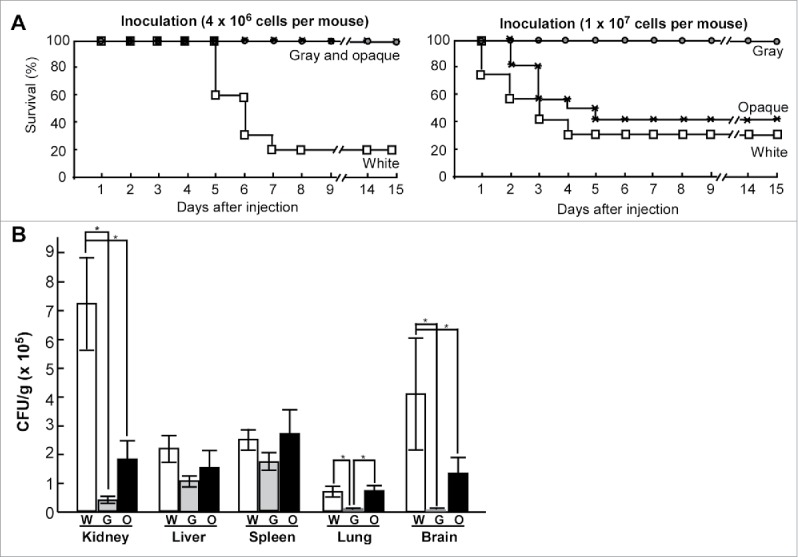
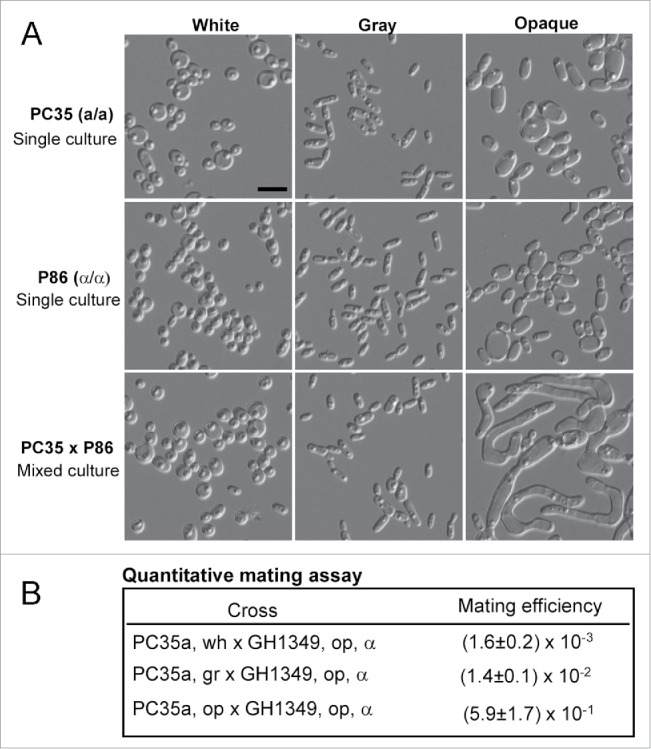
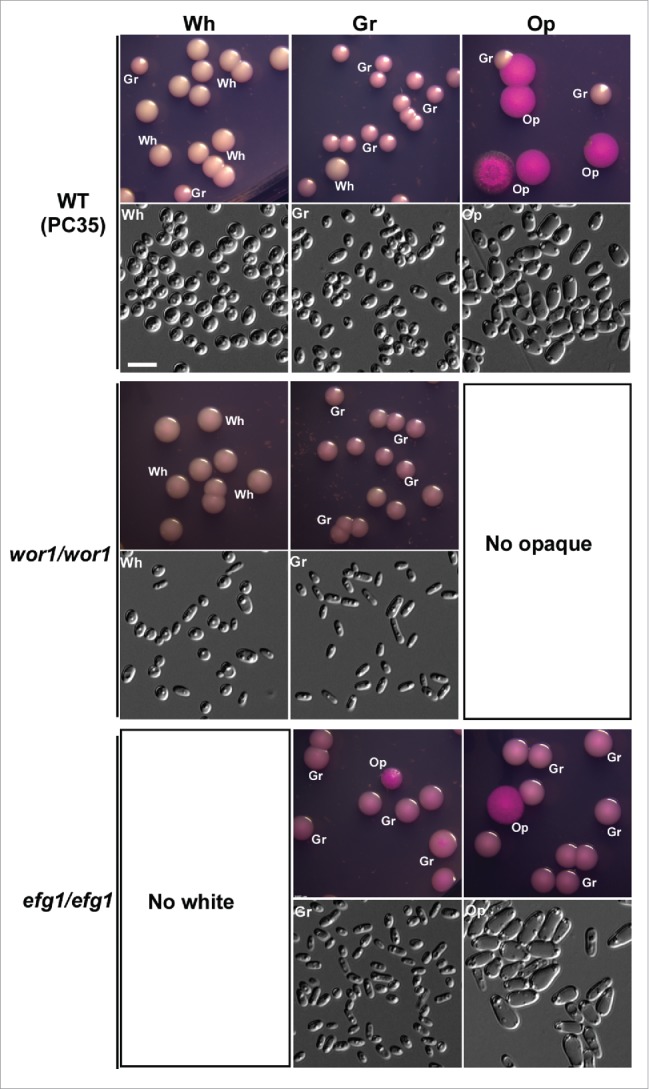
Candida dubliniensis is closely related to Candida albicans, a major causative agent of candidiasis, and is primarily associated with oral colonization and infection in human immunodeficiency virus (HIV)-positive patients. Despite the high similarity of genomic and phenotypic features between the 2 species, C. dubliniensis is much less virulent and less prevalent than C. albicans. The ability to change morphological phenotypes is a striking feature of Candida species and is linked to virulence. In this study, we report a novel phenotype, the gray phenotype, in C. dubliniensis. Together with the previously reported white and opaque cell types, the gray phenotype forms a tristable phenotypic switching system in C. dubliniensis that is similar to the white-gray-opaque tristable switching system in C. albicans. Gray cells of C. dubliniensis are similar to their counterparts in C. albicans in terms of several biological aspects including cellular morphology, mating competence, and genetic regulatory mechanisms. However, the gray phenotypes of the 2 species have some distinguishing features. For example, the secreted aspartyl protease (Sap) activity is induced by bovine serum albumin (BSA) in gray cells of C. albicans, but not in gray cells of C. dubliniensis. Taken together, our results demonstrate that the biological features and regulatory mechanisms of white-gray-opaque tristable transitions are largely conserved in the 2 pathogenic Candida species.

Keywords: Candida dubliniensis; Efg1; Wor1; pathogenesis; phenotypic switching.


Figures

Figure 1.
Figure 1.
White-gray-opaque transitions in C. albicans (BJ1097, A) and C. dubliniensis (PC35, B). Homogeneous white, gray, or opaque cells were plated on agar plates. Colony and cellular morphologies of the 3 different phenotypes (white, gray, and opaque) are shown. The colonies and cells were imaged after 5 d of growth at 25°C in 5% CO2. Scale bar, 10 μm. Phloxine B (a red dye that stains gray colonies light pink and opaque colonies red) was added at a concentration of 5 μg/mL to Lee's GlcNAc medium.
Figure 2.
Figure 2.
Switching frequencies of white-gray-opaque transitions in C. dubliniensis (PC35) under different culture conditions. Wh, white; Gr, gray; Op, opaque. Colonies (strain PC35) were grown under the indicated conditions at 25°C for 6 d. YPD, Lee's glucose, and Lee's GlcNAc media were used. Switching frequency = average ± standard deviation (SD). (A) Switching frequencies in air. (B) Switching frequencies in 5% CO2. (C) Switching frequencies in 20% CO2.
Figure 3.
Figure 3.
Global gene expression profiles in white, gray, and opaque cells of C. dubliniensis. Differentially expressed genes were identified by RNA-Seq analysis using a 2-fold cut-off. Wh, white; Gr, gray; Op, opaque. (A) Venn diagrams of differentially expressed genes between white-gray, white-opaque, and gray-opaque cell types. The numbers of cell type-specific genes are indicated. (B) White-, gray-, and opaque-specific genes.
Figure 4.
Figure 4.
White, gray, and opaque cells differ in virulence in mouse systemic infections. (A) Survival curves for white, gray, and opaque cells of strain PC35. Each cell type (4 × 10⁶, left, 10 mice used for each cell type; or 1 × 10⁷, right, 12 mice used for each cell type) was injected into each mouse via the tail vein. (B) Fungal burdens of white, gray, and opaque cells in different organs in a mouse systemic infection system. Each cell type (2 × 10⁶ cells in 200 μL of PBS) was injected into each mouse via the tail vein. Six mice were used for each cell type. The mice were killed at 24 hours after injection and 5 organs (liver, kidney, spleen, lung, and brain) were used for the fungal burden assays. The average numbers and standard deviations of the CFU per gram of different tissues are indicated. * indicates significantly difference (P value <0.05, Student's t-test, 2-tailed).
Figure 5.
Figure 5.
White, gray, and opaque cells exhibit different mating competence. (A) Mating assays performed in liquid Lee's GlcNAc medium between PC35 (MTLa/a, C. dubliniensis) and P86 (MTLα/α, C. dubliniensis). Cellular morphologies of single strain cultures and mixed cultures are shown. Single strain cultures: 5 × 10⁶ white, gray, or opaque cells of PC35 or P86 grown in 1 mL of Lee's GlcNAc medium at 25°C for 24 hours. Mixed cultures: 5 × 10⁶ white, gray, or opaque cells of PC35 mixed with 5 × 10⁶ cells of the same cell type of P86 and grown in 1 mL of Lee's GlcNAc medium at 25°C for 24 hours. Scale bar, 10 μm. (B) Quantitative mating assays. Experimental strain: PC35u (MTLa/a, ura3). Tester: C. albicans strain GH1349 (MTLα/α, arg4). White, gray, or opaque a/a cells of PC35 (5 × 10⁶ cells) were mixed with an equivalent number of opaque α cells (GH1349) in 10 μL of ddH2O, spotted onto Lee's GlcNAc medium plates and cultured at 25°C for 48 hours. The mating mixtures were replated onto SC-uridine, SC-arginine, and SC-uridine-arginine medium plates for prototrophic selection. Mating efficiency = average± standard deviation (SD).
Figure 6.
Figure 6.
Wor1 and Efg1 regulate white-gray-opaque transitions in C. dubliniensis. Wh, white; Gr, gray; Op, opaque. Cells were grown on Lee's GlcNAc medium in air at 25°C for 5 d The switching frequency data are shown in Figure S7. No opaque colonies were observed in the wor1/wor1 mutant, and no white colonies were observed in the efg1/efg1 mutant.

Comment in

Similar articles

Cited by

References

    1. Pfaller MA. Epidemiology of candidiasis. J Hosp Infect 1995; 30 Suppl:329-38; PMID:7560969; http://dx.doi.org/10.1016/0195-6701(95)90036-5 - DOI - PubMed
    1. Biswas S, Van Dijck P, Datta A. Environmental sensing and signal transduction pathways regulating morphopathogenic determinants of Candida albicans. Microbiol Mol Biol Rev 2007; 71:348-76; PMID:17554048; http://dx.doi.org/10.1128/MMBR.00009-06 - DOI - PMC - PubMed
    1. Pfaller MA, Diekema DJ. Epidemiology of invasive candidiasis: a persistent public health problem. Clin Microbiol Rev 2007; 20:133-63; PMID:17223626; http://dx.doi.org/10.1128/CMR.00029-06 - DOI - PMC - PubMed
    1. Whiteway M, Bachewich C. Morphogenesis in Candida albicans. Annu Rev Microbiol 2007; 61:529-53; PMID:17506678; http://dx.doi.org/10.1146/annurev.micro.61.080706.093341 - DOI - PMC - PubMed
    1. Huang G. Regulation of phenotypic transitions in the fungal pathogen Candida albicans. Virulence 2012; 3; 251-61; PMID:22546903; http://dx.doi.org/10.4161/viru.20010 - DOI - PMC - PubMed

Substances

LinkOut - more resources