. 2015 Dec 29;10(12):e0145574.
doi: 10.1371/journal.pone.0145574. eCollection 2015.

Advancing Land-Sea Conservation Planning: Integrating Modelling of Catchments, Land-Use Change, and River Plumes to Prioritise Catchment Management and Protection

Affiliations

Advancing Land-Sea Conservation Planning: Integrating Modelling of Catchments, Land-Use Change, and River Plumes to Prioritise Catchment Management and Protection

Jorge G Álvarez-Romero et al. PLoS One. .

Abstract

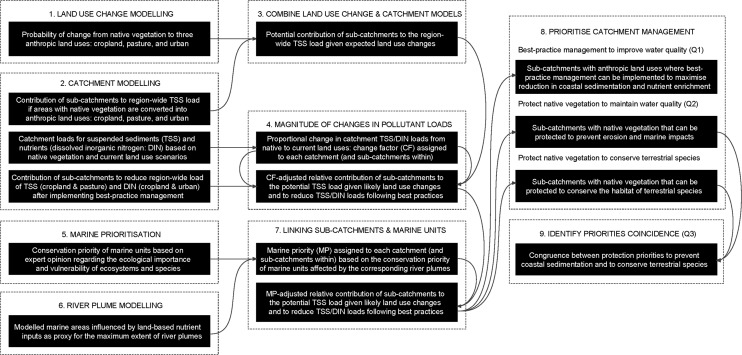
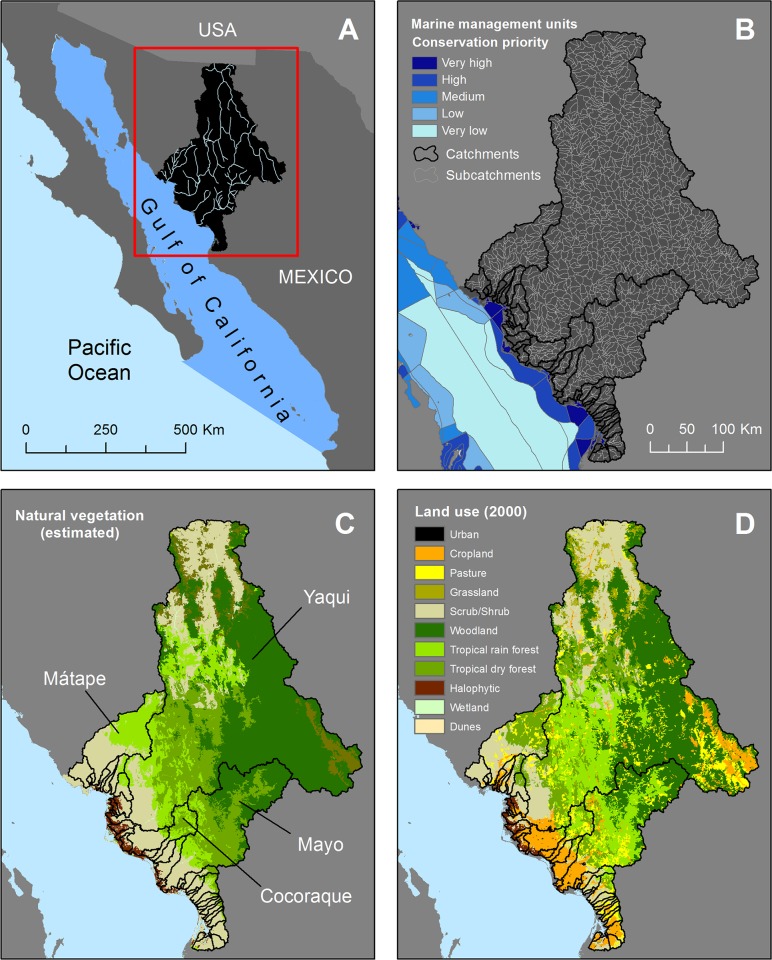
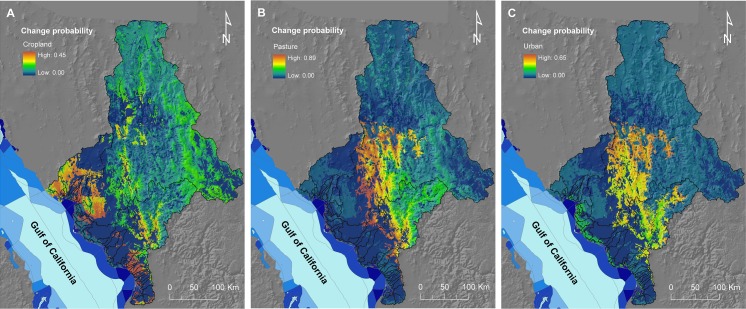
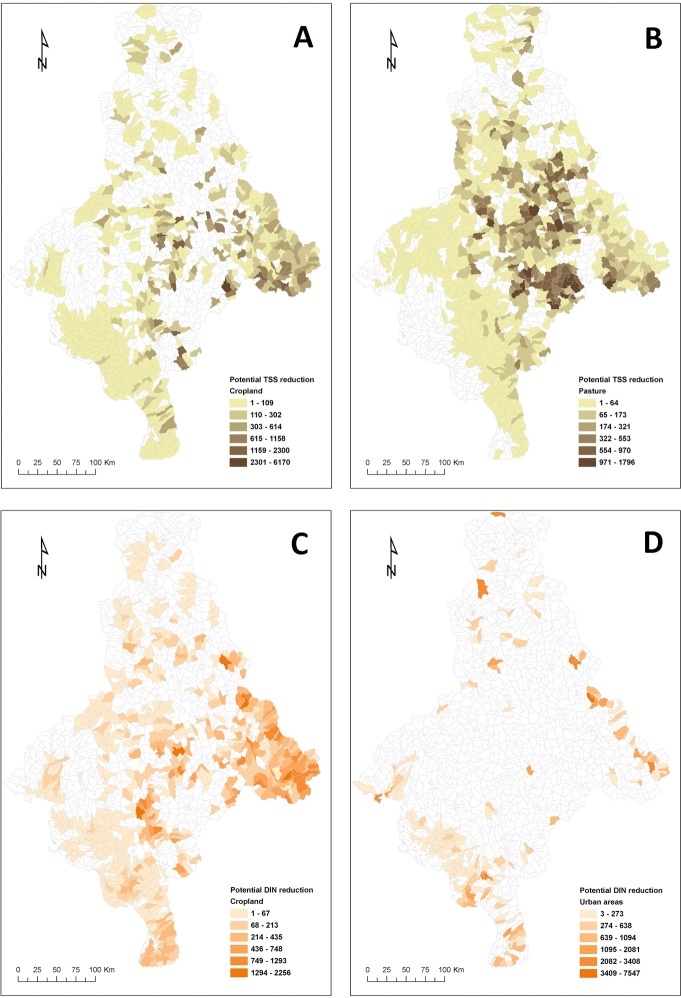
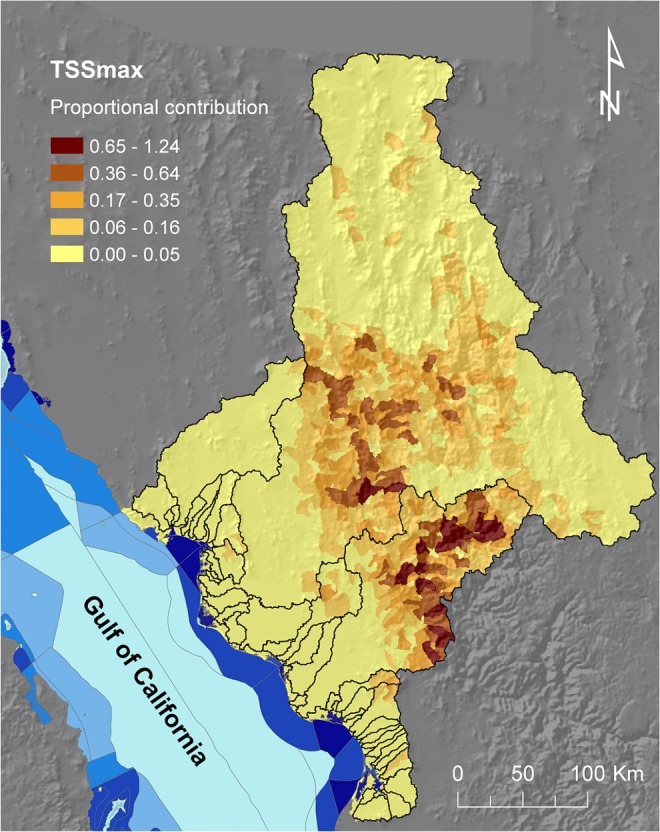
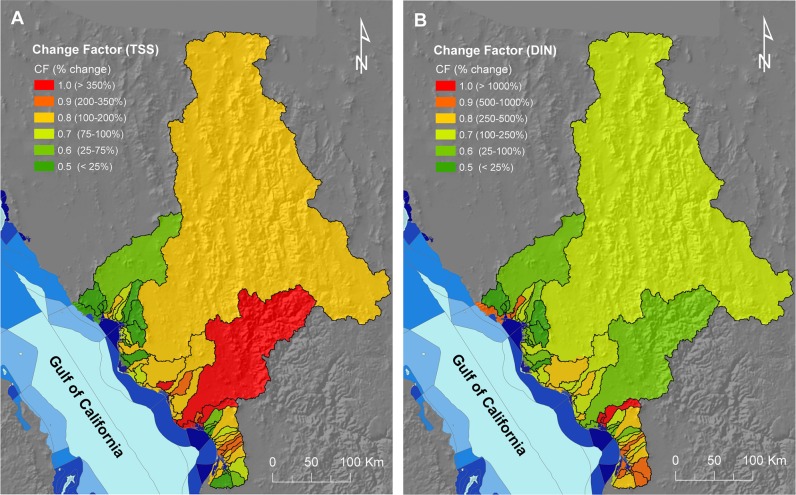
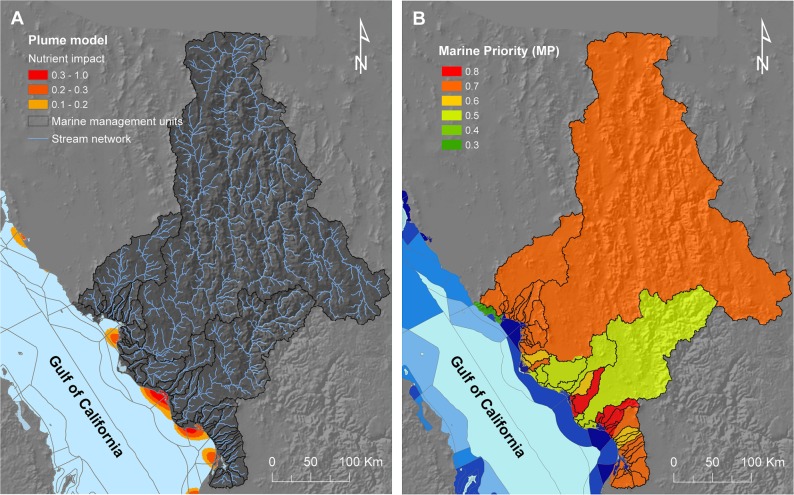
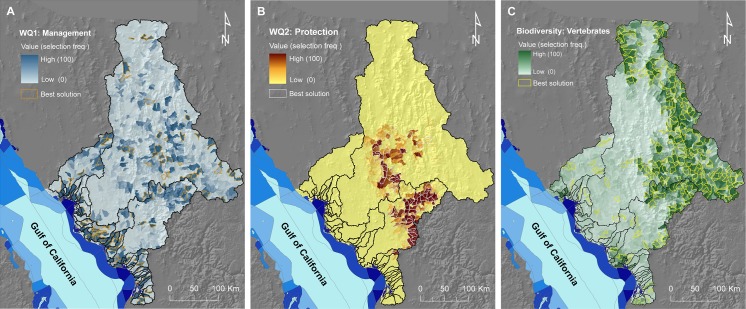
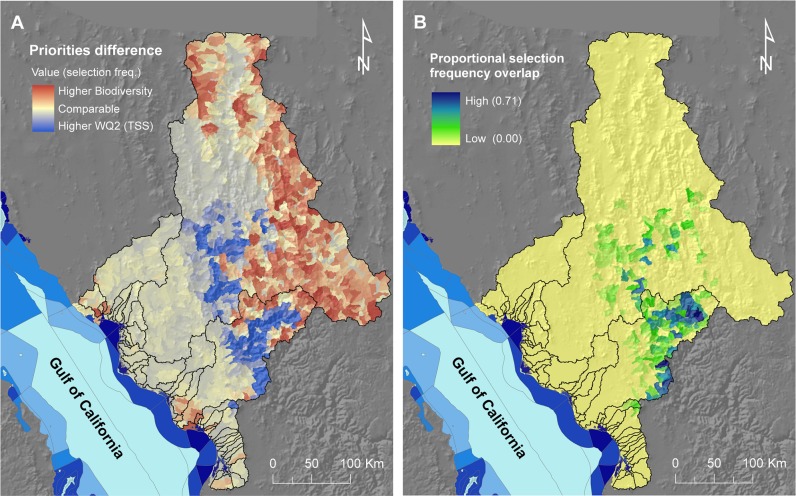
Human-induced changes to river loads of nutrients and sediments pose a significant threat to marine ecosystems. Ongoing land-use change can further increase these loads, and amplify the impacts of land-based threats on vulnerable marine ecosystems. Consequently, there is a need to assess these threats and prioritise actions to mitigate their impacts. A key question regarding prioritisation is whether actions in catchments to maintain coastal-marine water quality can be spatially congruent with actions for other management objectives, such as conserving terrestrial biodiversity. In selected catchments draining into the Gulf of California, Mexico, we employed Land Change Modeller to assess the vulnerability of areas with native vegetation to conversion into crops, pasture, and urban areas. We then used SedNet, a catchment modelling tool, to map the sources and estimate pollutant loads delivered to the Gulf by these catchments. Following these analyses, we used modelled river plumes to identify marine areas likely influenced by land-based pollutants. Finally, we prioritised areas for catchment management based on objectives for conservation of terrestrial biodiversity and objectives for water quality that recognised links between pollutant sources and affected marine areas. Our objectives for coastal-marine water quality were to reduce sediment and nutrient discharges from anthropic areas, and minimise future increases in coastal sedimentation and eutrophication. Our objectives for protection of terrestrial biodiversity covered species of vertebrates. We used Marxan, a conservation planning tool, to prioritise interventions and explore spatial differences in priorities for both objectives. Notable differences in the distributions of land values for terrestrial biodiversity and coastal-marine water quality indicated the likely need for trade-offs between catchment management objectives. However, there were priority areas that contributed to both sets of objectives. Our study demonstrates a practical approach to integrating models of catchments, land-use change, and river plumes with conservation planning software to inform prioritisation of catchment management.


Conflict of interest statement

Competing Interests: The authors have declared that no competing interests exist.

Figures

Fig 1
Fig 1. Integration of models and analyses for land-sea planning.
Dashed squares represent the models (or broad stages of our method) used to prioritise catchment management to achieve downstream (marine) and local (terrestrial) management objectives. Black boxes depict key outputs of models, as well as derived and integrated outputs resulting from further analyses. Numbers indicate the overall sequence of modelling/analysis and arrows show how outputs are integrated in later stages. Abbreviated question numbers in parenthesis (Q1 to Q3) on the right-hand side of the diagram indicate the final outputs used to answer our three research questions.
Fig 2
Fig 2. Study area: selected catchments draining into the Gulf of California, Mexico.
A) General location of study area and major rivers; B) Catchments, sub-catchments (planning units), and levels of conservation priority of adjacent marine management units; C) Estimated original extent of native vegetation types and largest catchments in the study area; and D) Current (2000) extent of vegetation types and anthropic land uses (cropland, pasture, and urban), reflecting the degree of human modification and underlying the spatial patterns of pollutant supply.
Fig 3
Fig 3. Probability of change from native vegetation classes to anthropic land uses.
Maps depict the probability of change from the eight native vegetation classes to A) cropland (P crops), B) pasture (P pasture), and C) urban areas (P urban) for a 20-year period (2000 to 2020), estimated using the land-use change model; also represented are the levels of conservation priority of adjacent marine management units (see legend in Fig 2B).
Fig 4
Fig 4. Estimated maximum reduction in the supply of TSS and DIN from anthropic land uses after implementing hypothetical best-practice management.
Maps show the maximum reduction (kg/year), at sub-catchment level, in total suspended sediment (TSS) supply for A) cropland and B) pasture; and in dissolved inorganic nitrogen (DIN) for C) cropland and D) urban areas. Only sub-catchments including anthropic land uses were targeted for management in the prioritisation analyses based on best-practice management scenarios.
Fig 5
Fig 5. Maximum proportional contribution (percentage) of sub-catchments to the region-wide TSS load, considering the potential conversion of native vegetation to anthropic areas.
The map integrates the individual maps depicting the potential supply of total suspended sediment (TSS) if natural vegetated areas are converted into anthropic land uses (i.e., cropland, pasture, or urban areas), each previously multiplied by the probability of change from native vegetation to the corresponding anthropic land use (Fig 3); also represented are the levels of conservation priority of adjacent marine management units (see legend in Fig 2B).
Fig 6
Fig 6. Change factors of the thirty-nine catchments in our study area.
Values for change factor (CF) were allocated according to the estimated change in (A) total suspended sediment (TSS) and (B) dissolved inorganic nitrogen (DIN) loads from the ‘natural’ (Fig 2C) to the ‘current’ (Fig 2D) vegetation/land use conditions. Also represented are the levels of conservation priority of adjacent marine management units (see legend in Fig 2B).
Fig 7
Fig 7. River-plume model and priority level of catchments for coastal-marine conservation.
A) River-plume model depicting potential impacts from land-based nutrient pollution [82] used as a proxy for the maximum extent of influence of rivers. B) Marine priority (MP) factor assigned to each catchment (and subsequently to the sub-catchments within them), representing their importance for marine conservation in terms of their link to marine management units of varying conservation priority (see legend in Fig 2B).
Fig 8
Fig 8. Priorities for catchment management and protection.
Maps show the relative value or priority of sub-catchments for achieving two sets of marine objectives (improving or maintaining end-of-river water quality) and one set of terrestrial objectives (conservation of terrestrial vertebrates). The values of planning units are represented by the selection frequency maps of Marxan. Sub-catchments selected more frequently in Marxan runs (darker colours) indicate their higher importance for achieving objectives. Also shown in the maps are the Marxan best solutions for each scenario. A) S1: Priorities for management to improve coastal-marine water quality by implementing best-practice management in anthropic land uses (cropland, pasture, and urban); B) S2: Priorities to maintain water quality through protection of remnant native vegetation to minimise the increase in sediment loads delivered to coastal-marine areas; and C) S3: Priorities for conservation of terrestrial vertebrate species; also represented is the level of conservation priority of adjacent marine management units (see legend in Fig 2B).
Fig 9
Fig 9. Spatial similarities and differences between priority maps for water quality protection and protection of terrestrial biodiversity.
A) Differences between the two maps calculated by subtracting the selection frequency map of S3 (terrestrial biodiversity) from that of S2 (water quality): red areas were preferentially selected for terrestrial biodiversity, while blue areas were selected more often for protection against erosion. Areas in beige and light red or light blue had comparable selection frequencies for the two scenarios (either both low or both high, but most of these areas depict areas of low selection frequencies in both scenarios). B) Areas of coincidence, measured as the number of times (out of 100 runs) units were selected in both scenarios; also represented is the level of conservation priority of adjacent marine management units (see legend in Fig 2B).

Similar articles

Cited by

References

    1. Halpern BS, Longo C, Hardy D, McLeod KL, Samhouri JF, Katona SK, et al. An index to assess the health and benefits of the global ocean. Nature. 2012;488(7413):615–20. 10.1038/nature11397 - DOI - PubMed
    1. Mullan-Crain C, Kroeker K, Halpern BS. Interactive and cumulative effects of multiple human stressors in marine systems. Ecology Letters. 2008;11(12):1304–15. 10.1111/j.1461-0248.2008.01253.x - DOI - PubMed
    1. Worm B, Barbier EB, Beaumont N, Duffy JE, Folke C, Halpern BS, et al. Impacts of biodiversity loss on ocean ecosystem services. Science. 2006;314(5800):787–90. - PubMed
    1. Walling DE. Human impact on land-ocean sediment transfer by the world's rivers. Geomorphology. 2006;79(3–4):192–216.
    1. Alvarez-Cobelas M, Angeler DG, Sánchez-Carrillo S. Export of nitrogen from catchments: A worldwide analysis. Environ Pollut. 2008;156(2):261–9. 10.1016/j.envpol.2008.02.016 - DOI - PubMed

Publication types

LinkOut - more resources