

Differential Cytotoxicity of Acetaminophen in Mouse Macrophage J774.2 and Human Hepatoma HepG2 Cells: Protection by Diallyl Sulfide
- PMID: 26714183
- PMCID: PMC4694617
- DOI: 10.1371/journal.pone.0145965
Differential Cytotoxicity of Acetaminophen in Mouse Macrophage J774.2 and Human Hepatoma HepG2 Cells: Protection by Diallyl Sulfide
Abstract
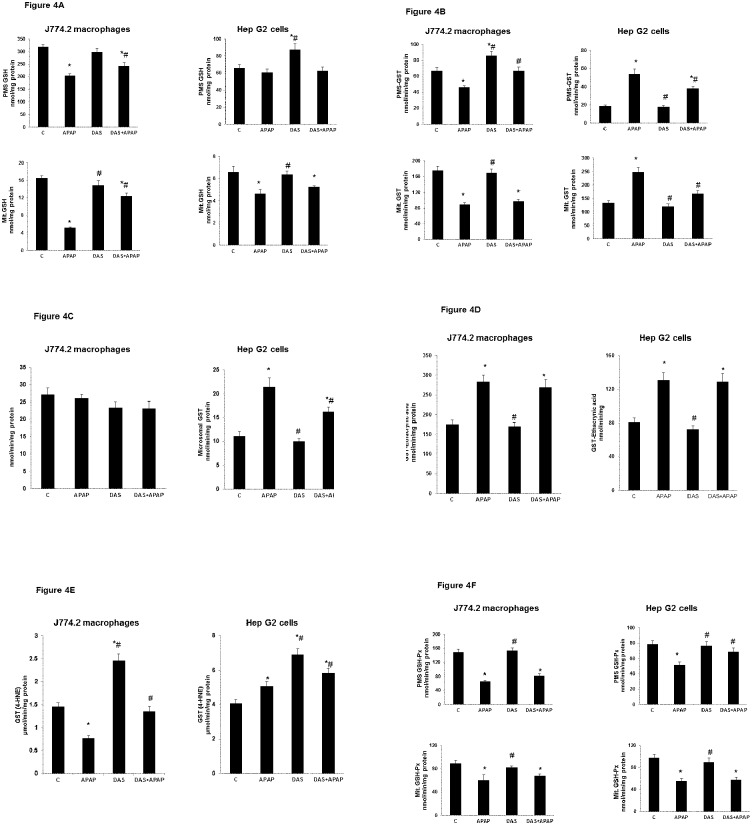
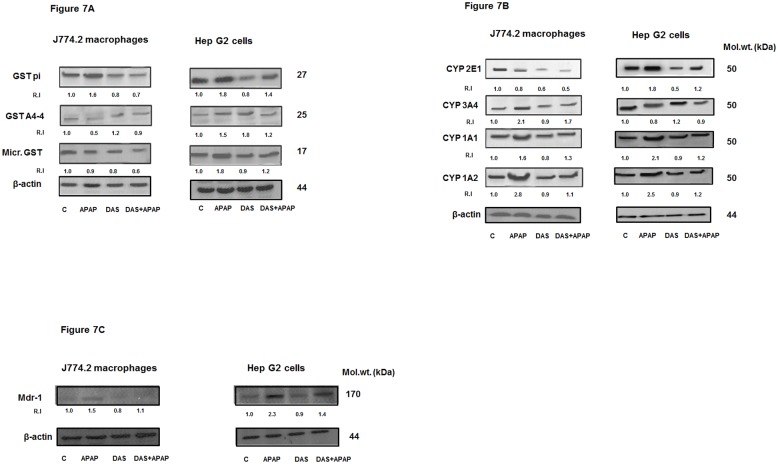
Non-steroidal anti-inflammatory drugs (NSAIDs), including acetaminophen (APAP), have been reported to induce cytotoxicity in cancer and non-cancerous cells. Overdose of acetaminophen (APAP) causes liver injury in humans and animals. Hepatic glutathione (GSH) depletion followed by oxidative stress and mitochondrial dysfunction are believed to be the main causes of APAP toxicity. The precise molecular mechanism of APAP toxicity in different cellular systems is, however, not clearly understood. Our previous studies on mouse macrophage J774.2 cells treated with APAP strongly suggest induction of apoptosis associated with mitochondrial dysfunction and oxidative stress. In the present study, using human hepatoma HepG2 cells, we have further demonstrated that macrophages are a more sensitive target for APAP-induced toxicity than HepG2 cells. Using similar dose- and time-point studies, a marked increase in apoptosis and DNA fragmentation were seen in macrophages compared to HepG2 cells. Differential effects of APAP on mitochondrial respiratory functions and oxidative stress were observed in the two cell lines which are presumably dependent on the varying degree of drug metabolism by the different cytochrome P450s and detoxification by glutathione S-transferase enzyme systems. Our results demonstrate a marked increase in the activity and expression of glutathione transferase (GST) and multidrug resistance (MDR1) proteins in APAP-treated HepG2 cells compared to macrophages. This may explain the apparent resistance of HepG2 cells to APAP toxicity. However, treatment of these cells with diallyl sulfide (DAS, 200 μM), a known chemopreventive agent from garlic extract, 24 h prior to APAP (10 μmol/ml for 18h) exhibited comparable cytoprotective effects in the two cell lines. These results may help in better understanding the mechanism of cytotoxicity caused by APAP and cytoprotection by chemopreventive agents in cancer and non-cancerous cellular systems.
Conflict of interest statement
Figures


Similar articles
-
Increased mitochondrial stress and modulation of mitochondrial respiratory enzyme activities in acetaminophen-induced toxicity in mouse macrophage cells.Food Chem Toxicol. 2010 Oct;48(10):2624-32. doi: 10.1016/j.fct.2010.06.031. Epub 2010 Jun 22. Food Chem Toxicol. 2010. PMID: 20600533
-
Acetylsalicylic acid-induced oxidative stress, cell cycle arrest, apoptosis and mitochondrial dysfunction in human hepatoma HepG2 cells.Eur J Pharmacol. 2011 Oct 1;668(1-2):15-24. doi: 10.1016/j.ejphar.2011.06.016. Epub 2011 Jun 25. Eur J Pharmacol. 2011. PMID: 21722632
-
Implications of altered glutathione metabolism in aspirin-induced oxidative stress and mitochondrial dysfunction in HepG2 cells.PLoS One. 2012;7(4):e36325. doi: 10.1371/journal.pone.0036325. Epub 2012 Apr 30. PLoS One. 2012. PMID: 22558435 Free PMC article.
-
Polyphenols reported to shift APAP-induced changes in MAPK signaling and toxicity outcomes.Chem Biol Interact. 2017 Nov 1;277:129-136. doi: 10.1016/j.cbi.2017.09.007. Epub 2017 Sep 13. Chem Biol Interact. 2017. PMID: 28918124 Review.
-
Oxidant stress, mitochondria, and cell death mechanisms in drug-induced liver injury: lessons learned from acetaminophen hepatotoxicity.Drug Metab Rev. 2012 Feb;44(1):88-106. doi: 10.3109/03602532.2011.602688. Epub 2012 Jan 10. Drug Metab Rev. 2012. PMID: 22229890 Free PMC article. Review.
Cited by
-
Azadirachtin Attenuates Carcinogen Benzo(a) Pyrene-Induced DNA Damage, Cell Cycle Arrest, Apoptosis, Inflammatory, Metabolic, and Oxidative Stress in HepG2 Cells.Antioxidants (Basel). 2023 Nov 14;12(11):2001. doi: 10.3390/antiox12112001. Antioxidants (Basel). 2023. PMID: 38001854 Free PMC article.
-
Potentiation of LPS-Induced Apoptotic Cell Death in Human Hepatoma HepG2 Cells by Aspirin via ROS and Mitochondrial Dysfunction: Protection by N-Acetyl Cysteine.PLoS One. 2016 Jul 21;11(7):e0159750. doi: 10.1371/journal.pone.0159750. eCollection 2016. PLoS One. 2016. PMID: 27441638 Free PMC article.
-
Predicting the efficacy of opioid sequestration by intravenous lipid emulsion using biologically relevant in vitro models of drug distribution.Sci Rep. 2022 Nov 4;12(1):18683. doi: 10.1038/s41598-022-21790-4. Sci Rep. 2022. PMID: 36333363 Free PMC article.
-
Kinetic characterizations of diallyl sulfide analogs for their novel role as CYP2E1 enzyme inhibitors.Pharmacol Res Perspect. 2017 Oct;5(5):e00362. doi: 10.1002/prp2.362. Pharmacol Res Perspect. 2017. PMID: 28971616 Free PMC article.
References
-
- Pachkoria K, Lucena MI, Molokhia M, Cueto R, Carballo AS, Carvajal A, et al. Genetic and molecular factors in drug-induced liver injury: a review. Curr Drug Saf. 2007; 2: 97–112. - PubMed
-
- Reid AB, Kurten RC, McCullough SS, Brock RW, Hinson JA. Mechanisms of acetaminophen-induced hepatotoxicity: role of oxidative stress and mitochondrial permeability transition in freshly isolated mouse hepatocytes. J Pharmacol Exp Ther. 2005; 312: 509–516. - PubMed
-
- Lazerow SK, Abdi MS, Lewis JH. Drug-induced liver disease 2004. Curr Opin Gastroenterol. 2005; 21: 283–292. - PubMed
-
- Lee WM. Acetaminophen and the U.S. Acute Liver Failure Study Group: lowering the risks of hepatic failure. Hepatology 2004; 40: 6–9. - PubMed
Publication types
MeSH terms
Substances
LinkOut - more resources
Full Text Sources
Other Literature Sources
Medical
Research Materials
