Individual Variability and Test-Retest Reliability Revealed by Ten Repeated Resting-State Brain Scans over One Month
- PMID: 26714192
- PMCID: PMC4694646
- DOI: 10.1371/journal.pone.0144963
Individual Variability and Test-Retest Reliability Revealed by Ten Repeated Resting-State Brain Scans over One Month
Abstract
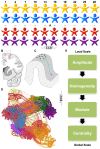
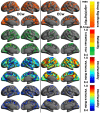
Individual differences in mind and behavior are believed to reflect the functional variability of the human brain. Due to the lack of a large-scale longitudinal dataset, the full landscape of variability within and between individual functional connectomes is largely unknown. We collected 300 resting-state functional magnetic resonance imaging (rfMRI) datasets from 30 healthy participants who were scanned every three days for one month. With these data, both intra- and inter-individual variability of six common rfMRI metrics, as well as their test-retest reliability, were estimated across multiple spatial scales. Global metrics were more dynamic than local regional metrics. Cognitive components involving working memory, inhibition, attention, language and related neural networks exhibited high intra-individual variability. In contrast, inter-individual variability demonstrated a more complex picture across the multiple scales of metrics. Limbic, default, frontoparietal and visual networks and their related cognitive components were more differentiable than somatomotor and attention networks across the participants. Analyzing both intra- and inter-individual variability revealed a set of high-resolution maps on test-retest reliability of the multi-scale connectomic metrics. These findings represent the first collection of individual differences in multi-scale and multi-metric characterization of the human functional connectomes in-vivo, serving as normal references for the field to guide the use of common functional metrics in rfMRI-based applications.
Conflict of interest statement
Figures


Similar articles
-
Test-retest reliabilities of resting-state FMRI measurements in human brain functional connectomics: a systems neuroscience perspective.Neurosci Biobehav Rev. 2014 Sep;45:100-18. doi: 10.1016/j.neubiorev.2014.05.009. Epub 2014 May 27. Neurosci Biobehav Rev. 2014. PMID: 24875392 Review.
-
Test-retest reliability of graph metrics in high-resolution functional connectomics: a resting-state functional MRI study.CNS Neurosci Ther. 2015 Oct;21(10):802-16. doi: 10.1111/cns.12431. Epub 2015 Jul 27. CNS Neurosci Ther. 2015. PMID: 26212146 Free PMC article.
-
Graph theoretical analysis of functional brain networks: test-retest evaluation on short- and long-term resting-state functional MRI data.PLoS One. 2011;6(7):e21976. doi: 10.1371/journal.pone.0021976. Epub 2011 Jul 19. PLoS One. 2011. PMID: 21818285 Free PMC article.
-
Test-retest reliability of dynamic functional connectivity in resting state fMRI.Neuroimage. 2018 Dec;183:907-918. doi: 10.1016/j.neuroimage.2018.08.021. Epub 2018 Aug 16. Neuroimage. 2018. PMID: 30120987
-
Graph theory approach for the structural-functional brain connectome of depression.Prog Neuropsychopharmacol Biol Psychiatry. 2021 Dec 20;111:110401. doi: 10.1016/j.pnpbp.2021.110401. Epub 2021 Jul 12. Prog Neuropsychopharmacol Biol Psychiatry. 2021. PMID: 34265367 Review.
Cited by
-
Dynamic community detection reveals transient reorganization of functional brain networks across a female menstrual cycle.Netw Neurosci. 2021 Feb 1;5(1):125-144. doi: 10.1162/netn_a_00169. eCollection 2021. Netw Neurosci. 2021. PMID: 33688609 Free PMC article.
-
PhiPipe: A multi-modal MRI data processing pipeline with test-retest reliability and predicative validity assessments.Hum Brain Mapp. 2023 Apr 1;44(5):2062-2084. doi: 10.1002/hbm.26194. Epub 2022 Dec 30. Hum Brain Mapp. 2023. PMID: 36583399 Free PMC article.
-
Commentary: A test-retest dataset for assessing long-term reliability of brain morphology and resting-state brain activity.Front Neurosci. 2017 Feb 22;11:85. doi: 10.3389/fnins.2017.00085. eCollection 2017. Front Neurosci. 2017. PMID: 28275335 Free PMC article. No abstract available.
-
Impact of concatenating fMRI data on reliability for functional connectomics.Neuroimage. 2021 Feb 1;226:117549. doi: 10.1016/j.neuroimage.2020.117549. Epub 2020 Nov 26. Neuroimage. 2021. PMID: 33248255 Free PMC article.
-
Variability and Reproducibility of Directed and Undirected Functional MRI Connectomes in the Human Brain.Entropy (Basel). 2019 Jul 6;21(7):661. doi: 10.3390/e21070661. Entropy (Basel). 2019. PMID: 33267375 Free PMC article.
References
Publication types
MeSH terms
LinkOut - more resources
Full Text Sources
Other Literature Sources
Medical

