. 2016 Feb;30(2):201-16.
doi: 10.1210/me.2015-1194. Epub 2015 Dec 29.

Hypoxia Increases IGFBP-1 Phosphorylation Mediated by mTOR Inhibition

Affiliations

Hypoxia Increases IGFBP-1 Phosphorylation Mediated by mTOR Inhibition

Ian Damerill et al. Mol Endocrinol. 2016 Feb.

Abstract

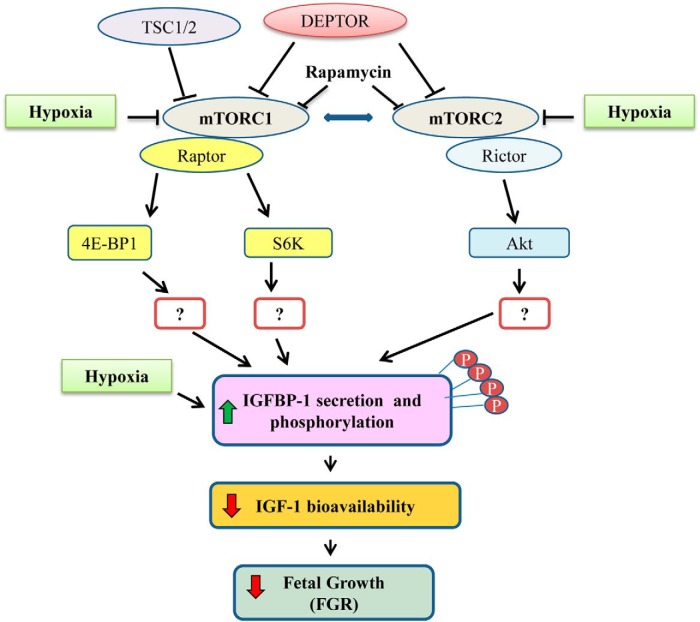
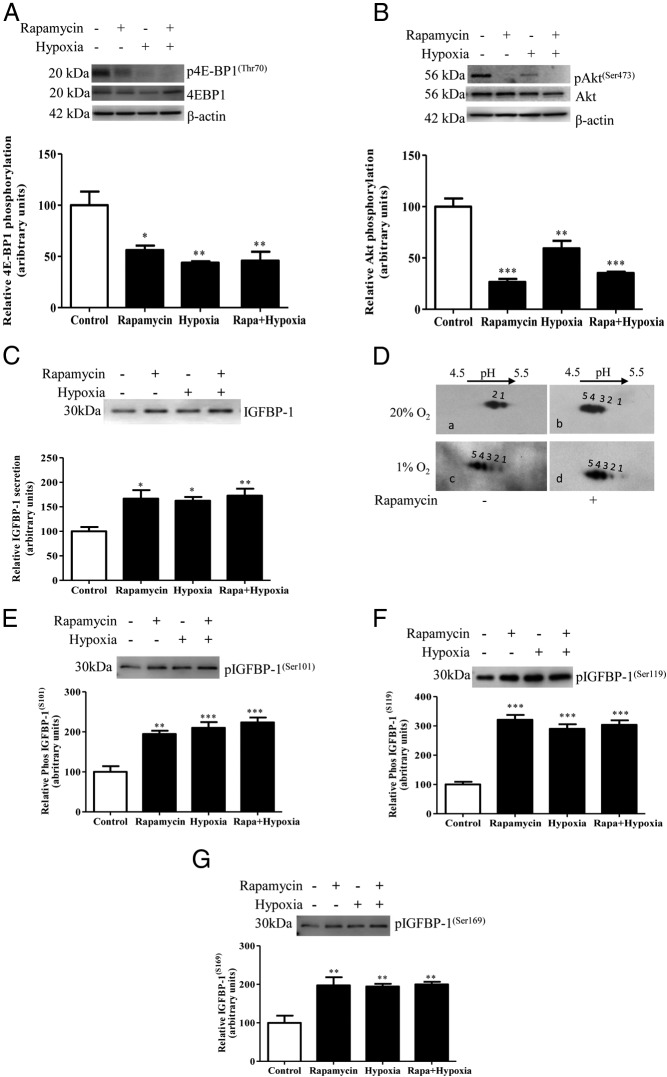
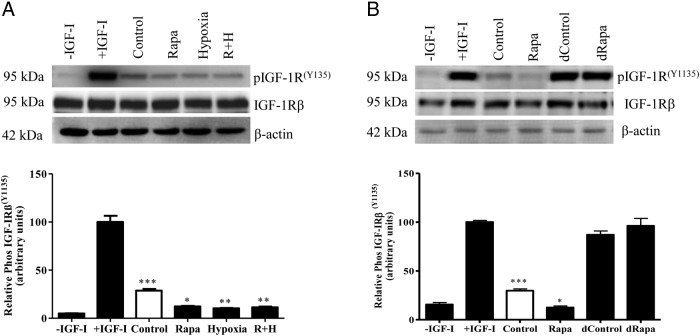
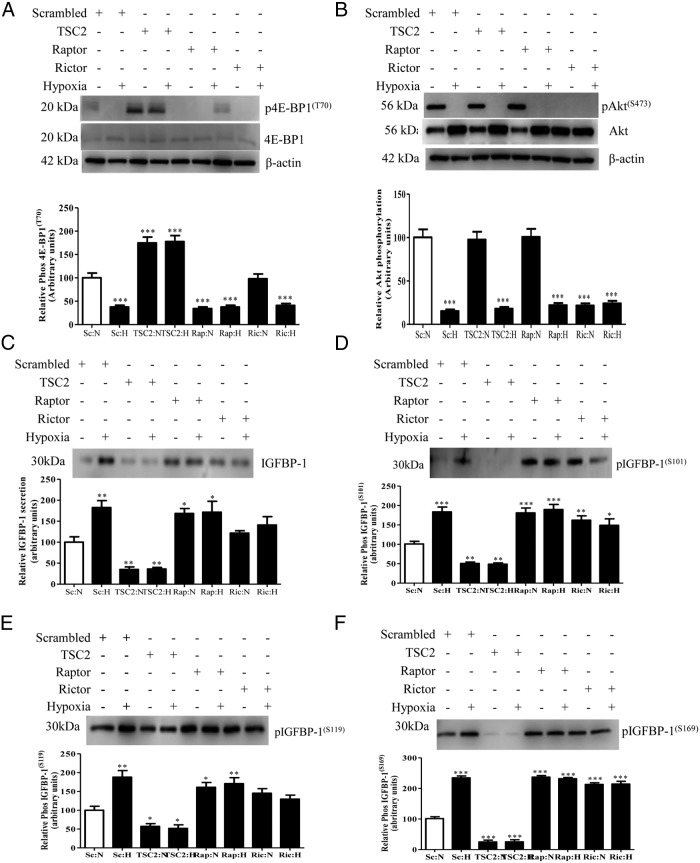
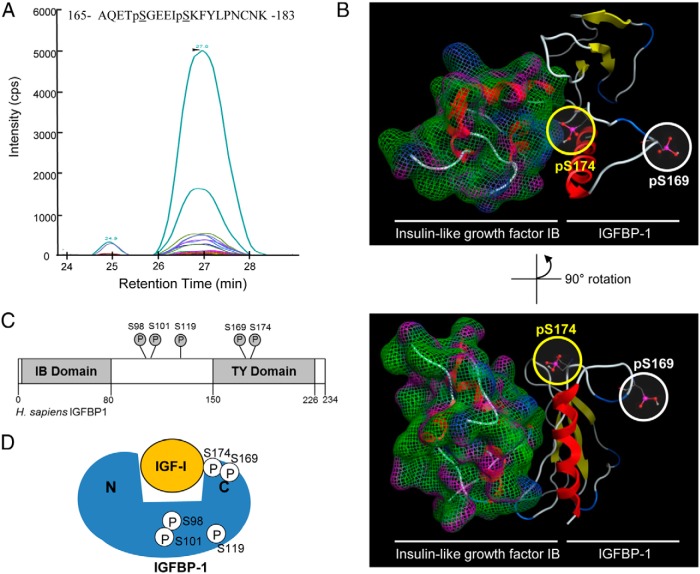
In fetal growth restriction (FGR), fetal growth is limited by reduced nutrient and oxygen supply. Insulin-like growth factor I (IGF-I) is a key regulator of fetal growth and IGF binding protein -1(IGFBP-1) is the principal regulator of fetal IGF-I bioavailability. Phosphorylation enhances IGFBP-1's affinity for IGF-I. Hypoxia induces IGFBP-1 hyperphosphorylation, markedly decreasing IGF-I bioavailability. We recently reported that fetal liver IGFBP-1 hyperphosphorylation is associated with inhibition of the mechanistic target of rapamycin (mTOR) in a nonhuman primate model of FGR. Here, we test the hypothesis that IGFBP-1 hyperphosphorylation in response to hypoxia is mediated by mTOR inhibition. We inhibited mTOR either by rapamycin or small interfering RNA (siRNA) targeting raptor (mTOR complex [mTORC]1) and/or rictor (mTORC2) in HepG2 cells cultured under hypoxia (1% O2) or basal (20% O2) conditions. Conversely, we activated mTORC1 or mTORC1+mTORC2 by silencing endogenous mTOR inhibitors (tuberous sclerosis complex 2/DEP-domain-containing and mTOR-interacting protein). Immunoblot analysis demonstrated that both hypoxia and inhibition of mTORC1 and/or mTORC2 induced similar degrees of IGFBP-1 phosphorylation at Ser101/119/169 and reduced IGF-I receptor autophosphorylation. Activation of mTORC1+mTORC2 or mTORC1 alone prevented IGFBP-1 hyperphosphorylation in response to hypoxia. Multiple reaction monitoring-mass spectrometry showed that rapamycin and/or hypoxia increased phosphorylation also at Ser98 and at a novel site Ser174. In silico structural analysis indicated that Ser174 was in close proximity to the IGF-binding site. Together, we demonstrate that signaling through the mTORC1 or mTORC2 pathway is sufficient to induce IGFBP-1 hyperphosphorylation in response to hypoxia. This study provides novel understanding of the cellular mechanism that controls fetal IGFBP-1 phosphorylation in hypoxia, and we propose that mTOR inhibition constitutes a mechanistic link between hypoxia, reduced IGF-I bioavailability and FGR.


Figures

Figure 1.
Figure 1.
Functionally important mTOR-related proteins linking mTOR to the regulation of IGFBP-1 secretion and phosphorylation. Schematic diagram representing a proposed model connecting mTOR signaling to IGFBP-1 secretion and phosphorylation. Key target proteins for silencing and functional readouts for mTORC1 and mTORC2 activity are presented.
Figure 2.
Figure 2.
The effect of hypoxia and/or rapamycin treatment on IGFBP-1 secretion and phosphorylation. Representative Western blottings of the functional readouts of (A) mTORC1, 4E-BP1 (Thr70) and (B) mTORC2, Akt (Ser473) phosphorylation. Phosphorylation of both mTORC1 and C2 was markedly inhibited by rapamycin, hypoxia, and rapamycin+hypoxia. C, A representative Western blotting of IGFBP-1 secreted from rapamycin, hypoxia, or rapamycin+hypoxia-treated cells. Rapamycin or hypoxia treatment significantly increased IGFBP-1 secretion. Combined rapamycin+hypoxia did not increase IGFBP-1 secretion more than either treatment alone. D, A representative 2-D Western blotting of IGFBP-1 phosphoisoforms in cell media from rapamycin, hypoxia, or rapamycin+hypoxia-treated cells. Rapamycin (top right) and hypoxia (bottom left) induced IGFBP-1 phosphorylation compared with normoxia (top left). In the presence of rapamycin, hypoxia did not cause any additional increases in phosphorylation (bottom right) compared with either treatment alone. E–G, Representative Western blottings of phosphorylated IGFBP-1 at Ser101, Ser119, and Ser169 in cell media of rapamycin, hypoxia, or rapamycin+hypoxia-treated cells. Rapamycin or hypoxia treatment significantly increased IGFBP-1 phosphorylation at all 3 serine sites. Combined rapamycin+hypoxia did not cause any additional increases in phosphorylation. Values are displayed as mean ± SEM; *, P < .05; **, P = .001-.05; ***, P < .0001 vs control; one-way ANOVA; Dunnet's multiple comparison test.
Figure 3.
Figure 3.
The effect of IGFBP-1 hyperphosphorylation on IGF-1Rβ autophosphorylation. A representative Western blotting of IGF-1R autophosphorylation in P6 cells. A, Equal concentrations of total IGFBP-1 from HepG2 cell media from rapamycin, hypoxia, or rapamycin+hypoxia were used to induce P6 cell IGF-1R autophosphorylation in presence of IGF-I. After that equal concentration of P6 cell lysate protein was used for immunoblot analysis to detect IGF-1Rβ (Tyr1135) autophosphorylation. Increased IGFBP-1 phosphorylation due to rapamycin, hypoxia, or combined rapamycin+hypoxia (R+H) resulted in significantly decreased IGF-1R activation compared with control. B, To validate that IGFBP-1 in HepG2 cell media was the source of IGF-1R inhibition, equal aliquots of cell media from control or rapamycin-treated cells were subjected to IGFBP-1 immunodepletion and used to then treat P6 cells in the presence of IGF-I. Immunodepleted cell media from control or rapamycin-treated HepG2 cells resulted in IGF-1Rβ autophosphorylation in P6 cells similar to the positive control (+IGF-I only), whereas the nondepleted control or rapamycin-treated samples retained significant inhibition of IGF-1Rβ activation (P < .0001). The percentage of inhibition of IGF-1R activation was considered significant at *, P < .05; **, P = .001-.05; ***, P < .0001 vs control; one-way ANOVA; Dunnet's multiple comparison test.
Figure 4.
Figure 4.
The effect of mTORC1+mTORC2 inhibition and/or activation with and without hypoxia (H) on IGFBP-1 secretion and phosphorylation. HepG2 cells were treated with DEPTOR siRNA or raptor+rictor siRNA, and then cells were additionally cultured in normoxia (N) or in H. Western blottings were performed on cell lysates or cell media from cells transfected with scramble (N), scramble (H), DEPTOR (N), DEPTOR (H), raptor+rictor (N), and rictor+rictor (H). A representative Western blotting of (A) 4E-BP1 phosphorylation (Thr70); H alone significantly inhibited 4E-BP1 phosphorylation. When treated with DEPTOR siRNA, 4E-BP1 phosphorylation was significantly increased regardless of hypoxic status, suggesting that DEPTOR knock down prevented mTORC1 inhibition due to H alone. When treated with raptor+rictor siRNA, 4E-BP1 phosphorylation was significantly inhibited regardless of hypoxic status. B, Akt phosphorylation (Ser473). H alone significantly inhibited Akt phosphorylation (Ser473). With DEPTOR siRNA, Akt phosphorylation (Ser473) was significantly increased regardless of hypoxic status, suggesting that DEPTOR knock down prevented mTORC2 inhibition due to H alone. Using raptor+rictor siRNA, Akt phosphorylation was significantly inhibited regardless of hypoxic status. A representative Western blotting of (C) IGFBP-1 secretion and (D–F) phosphorylated IGFBP-1 at Ser101, Ser119, and Ser169 from cell media. H alone significantly increased both IGFBP- 1 secretion and phosphorylation. When treated with DEPTOR siRNA, IGFBP-1 secretion and phosphorylation was not significantly different from controls regardless of hypoxic status, suggesting that constitutively activated mTOR signaling prevented the induction of IGFBP-1 secretion and phosphorylation due to H. Conversely, when treated with combined raptor+rictor siRNA, IGFBP-1 secretion and phosphorylation was significantly increased to levels similar to H alone, suggesting that H exerts it effects on both IGFBP-1 secretion and phosphorylation via mTORC1+C2 signaling. These data indicate that inhibition of mTOR during H is responsible for the regulation of IGFBP-1 phosphorylation. Values are displayed as mean ± SEM; *, P < .05; **, P = .001-.05; ***, P < .0001 vs control; one-way ANOVA; Dunnet's multiple comparison test.
Figure 5.
Figure 5.
The effect of mTORC1 activation and individual mTORC1 and mTORC2 inhibition with/without hypoxia on IGFBP-1 secretion/phosphorylation. HepG2 cells were treated with TSC2, raptor, or rictor siRNA, and then cells were additionally cultured in normoxia or in hypoxia. Western blottings were performed on cell lysates or cell media from cells transfected with scramble (normoxia), scramble (hypoxia), TSC2 (normoxia), TSC2 (hypoxia), raptor (normoxia), raptor (hypoxia), rictor (normoxia), and rictor (hypoxia) siRNA. A, A representative Western blotting of 4E-BP1 phosphorylation (Thr70). Hypoxia alone significantly inhibited 4E-BP1 (Thr70) phosphorylation. When treated with TSC2 siRNA, 4E- BP1 phosphorylation was significantly increased from control levels regardless of hypoxic status. Raptor siRNA significantly inhibited 4E-BP1 phosphorylation regardless of hypoxic status. Rictor siRNA did not affect 4E-BP1 phosphorylation, but 4E-BP1 phosphorylation was significantly reduced in rictor siRNA+hypoxia treatment. B, A representative Western blotting of Akt phosphorylation (Ser473). Hypoxia alone significantly inhibited Akt phosphorylation (Ser473). TSC2 siRNA did not affect Akt phosphorylation, although Akt phosphorylation was significantly reduced as a result of hypoxia during TSC2 siRNA. Similarly, raptor siRNA alone did not affect Akt phosphorylation, but raptor siRNA+hypoxia significantly reduced Akt phosphorylation. Rictor siRNA significantly reduced Akt phosphorylation regardless of hypoxic status. Representative Western blottings of (C) IGFBP-1 secretion and (D–F) phosphorylated IGFBP-1 at Ser101, Ser119, and Ser169 from cell media. Hypoxia alone significantly increased IGFBP-1 secretion and phosphorylation. When treated with TSC2 siRNA, IGFBP-1 secretion and phosphorylation was significantly reduced from control levels regardless of hypoxic status, suggesting that constitutively activated mTORC1 signaling prevented the induction of IGFBP-1 secretion and phosphorylation due to hypoxia. Conversely, when treated with individual raptor or rictor siRNA, IGFBP-1 secretion and phosphorylation was significantly increased to levels similar to hypoxia alone, suggesting that hypoxia exerts it effects on IGFBP-1 secretion and phosphorylation via mTORC1 or combined mTORC1+C2 inhibition. Values are displayed as mean ± SEM; *, P < .05; **, P = .001-.05; ***, P < .0001 vs control; one-way ANOVA; Dunnet's multiple comparison test.
Figure 6.
Figure 6.
MRM-MS analysis for assessment of IGFBP-1 phosphorylation sites and validation of immunoblot data. A, MRM transitions used to detect relative rapamycin-induced phosphorylation of IGFBP-1 at Ser98, Ser101, Ser119, Ser169, and Ser174 (see Supplemental Table 1 for transition list). B–D, Relative IGFBP-1 phosphorylation induced by rapamycin, hypoxia, or rapamycin+hypoxia-treated HepG2 cells. Distinct phosphorylation sites were detected in IGFBP-1 (IP) samples using MRM-MS. Shown is Ser98+Ser101 value displayed as combined Ser101+dual phosphorylated, Ser98+Ser101; Ser169+Ser174 value displayed as combined Ser169+dual phosphorylated Ser169+Ser174 values. E, Relative IGFBP-1 phosphorylation individually at Ser169, Ser174, and dual phosphorylated Ser169+Ser 174 after DEPTOR siRNA and DEPTOR siRNA+hypoxia treatments. Data are represented as total transition peak intensity relative to untreated control samples (set to a value of 1) and normalized to a nonphosphorylated internal peptide within the IGFBP-1 protein (standard).
Figure 7.
Figure 7.
Discovery of IGFBP-1 (Ser174) phosphorylation. MRM transitions used for the discovery and detection of dual phosphorylation at Ser169 and Ser174. Colored traces represent the detection and specificity of each transition ion generated specifically from the dual phosphorylated IGFBP-1 at Ser169 and Ser174 (see Supplemental Table 2 for transition list). B, Molecular modeling of the IGFBP C terminus and IGF-IB complex, based on the available crystal structure (2DSQ). Both the phosphorylated Ser174 and Ser169 residues are highlighted. The C terminus of IGFBP-1 was modeled from the available PDB 2DSQ:G crystal structure. C, Schematic of IGFBP-1 and phosphorylation sites (Ser98, Ser101, Ser119, Ser169, and Ser174) in proximity to the IGFBP-1-IGF-binding (IB) and TY domains. Phosphorylation sites Ser98, Ser101, and Ser119 are found within the interdomain region, whereas both Ser169 and Ser174 are within the TY domain. D, Proximity of the studied phosphorylation sites within the IGFBP-1 protein, relative to each other and to the IGF-I-binding site.

Similar articles

Cited by

References

    1. Eleftheriades M, Creatsas G, Nicolaides K. Fetal growth restriction and postnatal development. Ann NY Acad Sci. 2006;1092:319–330. - PubMed
    1. Kinzler WL, Vintzileos AM. Fetal growth restriction: a modern approach. Curr Opin Obstet Gynecol. 2008;20:125–131. - PubMed
    1. Ruijtenbeek K, Kessels LC, De Mey JG, Blanco CE. Chronic moderate hypoxia and protein malnutrition both induce growth retardation, but have distinct effects on arterial endothelium-dependent reactivity in the chicken embryo. Pediatr Res. 2003;53:573–579. - PubMed
    1. Randhawa R, Cohen P. The role of the insulin-like growth factor system in prenatal growth. Mol Genet Metab. 2005;86:84–90. - PubMed
    1. Tazuke SI, Mazure NM, Sugawara J, et al. Hypoxia stimulates insulin-like growth factor binding protein 1 (IGFBP-1) gene expression in HepG2 cells: a possible model for IGFBP-1 expression in fetal hypoxia. Proc Natl Acad Sci USA. 1998;95:10188–10193. - PMC - PubMed

Publication types

MeSH terms

Substances