Genome-Wide Association Study of Grain Appearance and Milling Quality in a Worldwide Collection of Indica Rice Germplasm
- PMID: 26714258
- PMCID: PMC4694703
- DOI: 10.1371/journal.pone.0145577
Genome-Wide Association Study of Grain Appearance and Milling Quality in a Worldwide Collection of Indica Rice Germplasm
Abstract
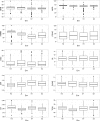
Grain appearance quality and milling quality are the main determinants of market value of rice. Breeding for improved grain quality is a major objective of rice breeding worldwide. Identification of genes/QTL controlling quality traits is the prerequisite for increasing breeding efficiency through marker-assisted selection. Here, we reported a genome-wide association study in indica rice to identify QTL associated with 10 appearance and milling quality related traits, including grain length, grain width, grain length to width ratio, grain thickness, thousand grain weight, degree of endosperm chalkiness, percentage of grains with chalkiness, brown rice rate, milled rice rate and head milled rice rate. A diversity panel consisting of 272 indica accessions collected worldwide was evaluated in four locations including Hangzhou, Jingzhou, Sanya and Shenzhen representing indica rice production environments in China and genotyped using genotyping-by-sequencing and Diversity Arrays Technology based on next-generation sequencing technique called DArTseq™. A wide range of variation was observed for all traits in all environments. A total of 16 different association analysis models were compared to determine the best model for each trait-environment combination. Association mapping based on 18,824 high quality markers yielded 38 QTL for the 10 traits. Five of the detected QTL corresponded to known genes or fine mapped QTL. Among the 33 novel QTL identified, qDEC1.1 (qGLWR1.1), qBRR2.2 (qGL2.1), qTGW2.1 (qGL2.2), qGW11.1 (qMRR11.1) and qGL7.1 affected multiple traits with relatively large effects and/or were detected in multiple environments. The research provided an insight of the genetic architecture of rice grain quality and important information for mining genes/QTL with large effects within indica accessions for rice breeding.
Conflict of interest statement
Figures


Similar articles
-
Genome wide association mapping for grain shape traits in indica rice.Planta. 2016 Oct;244(4):819-30. doi: 10.1007/s00425-016-2548-9. Epub 2016 May 19. Planta. 2016. PMID: 27198135 Free PMC article.
-
Examining two sets of introgression lines reveals background-independent and stably expressed QTL that improve grain appearance quality in rice (Oryza sativa L.).Theor Appl Genet. 2017 May;130(5):951-967. doi: 10.1007/s00122-017-2862-z. Epub 2017 Mar 15. Theor Appl Genet. 2017. PMID: 28299373 Free PMC article.
-
Diversity analysis and genome-wide association studies of grain shape and eating quality traits in rice (Oryza sativa L.) using DArT markers.PLoS One. 2018 Jun 1;13(6):e0198012. doi: 10.1371/journal.pone.0198012. eCollection 2018. PLoS One. 2018. PMID: 29856872 Free PMC article.
-
[Current status and strategies for improvement of rice grain chalkiness].Yi Chuan. 2009 Jun;31(6):563-72. doi: 10.3724/sp.j.1005.2009.00563. Yi Chuan. 2009. PMID: 19586854 Review. Chinese.
-
Designing climate-resilient rice with ideal grain quality suited for high-temperature stress.J Exp Bot. 2015 Apr;66(7):1737-48. doi: 10.1093/jxb/eru544. Epub 2015 Feb 5. J Exp Bot. 2015. PMID: 25662847 Free PMC article. Review.
Cited by
-
Genetic dissection of grain traits and their corresponding heterosis in an elite hybrid.Front Plant Sci. 2022 Oct 5;13:977349. doi: 10.3389/fpls.2022.977349. eCollection 2022. Front Plant Sci. 2022. PMID: 36275576 Free PMC article.
-
Use of Artificial Neural Network Model for Rice Quality Prediction Based on Grain Physical Parameters.Foods. 2021 Dec 5;10(12):3016. doi: 10.3390/foods10123016. Foods. 2021. PMID: 34945567 Free PMC article.
-
Identification and Pleiotropic Effect Analysis of GSE5 on Rice Chalkiness and Grain Shape.Front Plant Sci. 2022 Jan 20;12:814928. doi: 10.3389/fpls.2021.814928. eCollection 2021. Front Plant Sci. 2022. PMID: 35126437 Free PMC article.
-
Genome-Wide Association Study of Rice Grain Shape and Chalkiness in a Worldwide Collection of Xian Accessions.Plants (Basel). 2023 Jan 17;12(3):419. doi: 10.3390/plants12030419. Plants (Basel). 2023. PMID: 36771503 Free PMC article.
-
Association mapping and genetic dissection of drought-induced canopy temperature differences in rice.J Exp Bot. 2020 Feb 19;71(4):1614-1627. doi: 10.1093/jxb/erz527. J Exp Bot. 2020. PMID: 31846000 Free PMC article.
References
-
- Unnevehr L, Duff B, Juliano BO. Consumer Demand for Rice Grain Quality: Terminal Report of IDRC Projects, National Grain Quality (Asia), and International Grain Quality Economics (Asia): Int. Rice Res. Inst.; 1992.
-
- Cheng FM, Zhong LJ, Wang F, Zhang GP. Differences in cooking and eating properties between chalky and translucent parts in rice grains. Food Chemistry. 2005;90(1–2):39–46. 10.1016/j.foodchem.2004.03.018. - DOI
-
- Yu S, Yang C, Fan Y, Zhuang J, Li X. Genetic dissection of a thousand-grain weight quantitative trait locus on rice chromosome 1. Chinese Science Bulletin. 2008;53(15):2326–32. 10.1007/s11434-008-0281-x - DOI
Publication types
MeSH terms
Substances
LinkOut - more resources
Full Text Sources
Other Literature Sources

