

Weather-Related Flood and Landslide Damage: A Risk Index for Italian Regions
- PMID: 26714309
- PMCID: PMC4694658
- DOI: 10.1371/journal.pone.0144468
Weather-Related Flood and Landslide Damage: A Risk Index for Italian Regions
Abstract
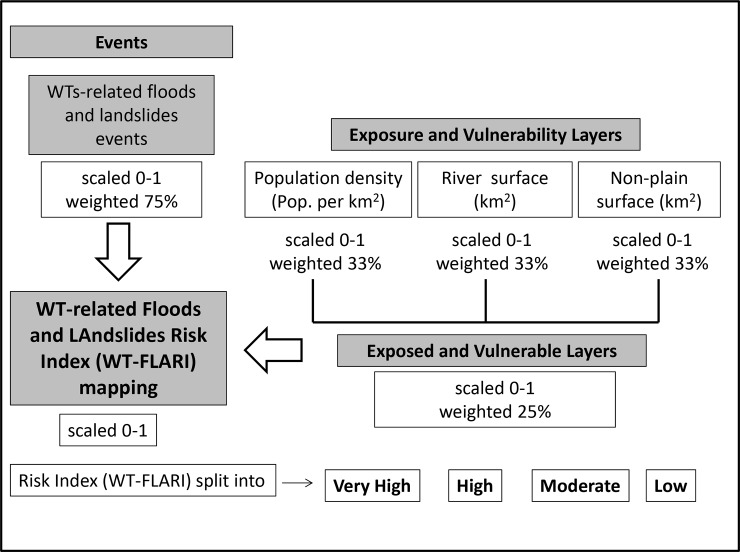
The frequency of natural hazards has been increasing in the last decades in Europe and specifically in Mediterranean regions due to climate change. For example heavy precipitation events can lead to disasters through the interaction with exposed and vulnerable people and natural systems. It is therefore necessary a prevention planning to preserve human health and to reduce economic losses. Prevention should mainly be carried out with more adequate land management, also supported by the development of an appropriate risk prediction tool based on weather forecasts. The main aim of this study is to investigate the relationship between weather types (WTs) and the frequency of floods and landslides that have caused damage to properties, personal injuries, or deaths in the Italian regions over recent decades. In particular, a specific risk index (WT-FLARI) for each WT was developed at national and regional scale. This study has identified a specific risk index associated with each weather type, calibrated for each Italian region and applicable to both annual and seasonal levels. The risk index represents the seasonal and annual vulnerability of each Italian region and indicates that additional preventive actions are necessary for some regions. The results of this study represent a good starting point towards the development of a tool to support policy-makers, local authorities and health agencies in planning actions, mainly in the medium to long term, aimed at the weather damage reduction that represents an important issue of the World Meteorological Organization mission.
Conflict of interest statement
Figures


Similar articles
-
Gender, age and circumstances analysis of flood and landslide fatalities in Italy.Sci Total Environ. 2018 Jan 1;610-611:867-879. doi: 10.1016/j.scitotenv.2017.08.064. Epub 2017 Aug 18. Sci Total Environ. 2018. PMID: 28826124
-
Evaluation of flood and landslide risk to the population of Italy.Environ Manage. 2005 Jul;36(1):15-36. doi: 10.1007/s00267-003-0257-1. Environ Manage. 2005. PMID: 15983861
-
A multi-disciplinary approach to evaluate pluvial floods risk under changing climate: The case study of the municipality of Venice (Italy).Sci Total Environ. 2016 Aug 15;562:1031-1043. doi: 10.1016/j.scitotenv.2016.03.150. Epub 2016 May 6. Sci Total Environ. 2016. PMID: 27161907
-
Climate Change, Extreme Weather Events, and Human Health Implications in the Asia Pacific Region.Asia Pac J Public Health. 2016 Mar;28(2 Suppl):8S-14S. doi: 10.1177/1010539515599030. Epub 2015 Sep 16. Asia Pac J Public Health. 2016. PMID: 26377857 Review.
-
The potential impacts of climate variability and change on health impacts of extreme weather events in the United States.Environ Health Perspect. 2001 May;109 Suppl 2(Suppl 2):191-8. doi: 10.1289/ehp.109-1240666. Environ Health Perspect. 2001. PMID: 11359686 Free PMC article. Review.
Cited by
-
Heat Stress Perception among Native and Migrant Workers in Italian Industries-Case Studies from the Construction and Agricultural Sectors.Int J Environ Res Public Health. 2019 Mar 27;16(7):1090. doi: 10.3390/ijerph16071090. Int J Environ Res Public Health. 2019. PMID: 30934675 Free PMC article.
-
Overview of Existing Heat-Health Warning Systems in Europe.Int J Environ Res Public Health. 2019 Jul 25;16(15):2657. doi: 10.3390/ijerph16152657. Int J Environ Res Public Health. 2019. PMID: 31349585 Free PMC article. Review.
-
Performances of Limited Area Models for the WORKLIMATE Heat-Health Warning System to Protect Worker's Health and Productivity in Italy.Int J Environ Res Public Health. 2021 Sep 21;18(18):9940. doi: 10.3390/ijerph18189940. Int J Environ Res Public Health. 2021. PMID: 34574860 Free PMC article.
-
Disasters in Spain from 1950 - 2020: Impact on Public Health.Prehosp Disaster Med. 2023 Apr;38(2):264-269. doi: 10.1017/S1049023X23000225. Epub 2023 Mar 13. Prehosp Disaster Med. 2023. PMID: 36912177 Free PMC article.
-
Evolving Trends and Research Hotspots in Disaster Epidemiology From 1985 to 2020: A Bibliometric Analysis.Front Public Health. 2021 Aug 30;9:720787. doi: 10.3389/fpubh.2021.720787. eCollection 2021. Front Public Health. 2021. PMID: 34527652 Free PMC article.
References
-
- Kunkel KE, Pielke JR, Changnon SA (1999) Temporal fluctuations in weather and climate extremes that cause economic and human health impacts: a review. Bull. A M. Meteorol Soc 80:1077–1099. doi:101175/1520-0477(1999)080-1077:TFIWAC-2.0.CO
-
- Kharin VV, Zwiers FW, Zhang X, Hegerl GC (2007). Changes in temperature and precipitation extremes in the IPCC ensemble of global coupled model simulations. Journal Clim 20: 1419–1444. 10.1175/JCLI4066.1 - DOI
-
- Harmeling S (2010) Global climate risk index 2010. Who is most vulnerable? Weather-related loss events since 1990 and how Copenhagen needs to respond. Bonn, Germany, Germanwatch Breafing Paper. 20pp
-
- WHO (2010) Report Climate Change, extreme weather events and public health Copenaghen, WHO Regional Office for Europe; 37pp
-
- Trenberth KE (2011) Changes in precipitation with climate change. Contribution to CR Special 25 “Climate services for sustainable development” 47: 123–138. doi: 103354/cr00953
Publication types
MeSH terms
LinkOut - more resources
Full Text Sources
Other Literature Sources
Medical
