Prognostic Implication of M2 Macrophages Are Determined by the Proportional Balance of Tumor Associated Macrophages and Tumor Infiltrating Lymphocytes in Microsatellite-Unstable Gastric Carcinoma
- PMID: 26714314
- PMCID: PMC4699826
- DOI: 10.1371/journal.pone.0144192
Prognostic Implication of M2 Macrophages Are Determined by the Proportional Balance of Tumor Associated Macrophages and Tumor Infiltrating Lymphocytes in Microsatellite-Unstable Gastric Carcinoma
Abstract
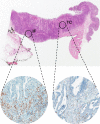
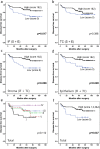
Tumor associated macrophages are major inflammatory cells that play an important role in the tumor microenvironment. In this study, we investigated the prognostic significance of tumor associated macrophages (TAMs) in MSI-high gastric cancers using immunohistochemistry. CD68 and CD163 were used as markers for total infiltrating macrophages and M2-polarized macrophages, respectively. The density of CD68+ or CD163+ TAMs in four different areas (epithelial and stromal compartments of both the tumor center and invasive front) were analyzed in 143 cases of MSI-high advanced gastric cancers using a computerized image analysis system. Gastric cancers were scored as "0" or "1" in each area when the density of CD68+ and CD163+ TAMs was below or above the median value. Low density of CD68+ or CD163+ macrophages in four combined areas was closely associated with more frequent low-grade histology and the intestinal type tumor of the Lauren classification. In survival analysis, the low density of CD163+ TAMs was significantly associated with poor disease-free survival. In multivariate survival analysis, CD163+ TAMs in four combined areas, stromal and epithelial compartments of both tumor center and invasive front were independent prognostic indicator in MSI-high gastric cancers. In addition, the density of CD163+ TAMs correlated with tumor infiltrating lymphocytes (TILs). Our results indicate that the high density of CD163+ TAMs is an independent prognostic marker heralding prolonged disease-free survival and that the prognostic implication of CD163+ TAMs might be determined by the proportional balance of TAMs and TILs in MSI-high gastric cancers.
Conflict of interest statement
Figures


Similar articles
-
Elevated CD163+/CD68+ Ratio at Tumor Invasive Front is Closely Associated with Aggressive Phenotype and Poor Prognosis in Colorectal Cancer.Int J Biol Sci. 2019 Mar 10;15(5):984-998. doi: 10.7150/ijbs.29836. eCollection 2019. Int J Biol Sci. 2019. PMID: 31182919 Free PMC article.
-
Expression of M2-polarized macrophages is associated with poor prognosis for advanced epithelial ovarian cancer.Technol Cancer Res Treat. 2013 Jun;12(3):259-67. doi: 10.7785/tcrt.2012.500312. Epub 2012 Dec 26. Technol Cancer Res Treat. 2013. PMID: 23289476
-
The presence of tumor associated macrophages in tumor stroma as a prognostic marker for breast cancer patients.BMC Cancer. 2012 Jul 23;12:306. doi: 10.1186/1471-2407-12-306. BMC Cancer. 2012. PMID: 22824040 Free PMC article.
-
Prognostic significance of CD68+ and CD163+ tumor associated macrophages in head and neck squamous cell carcinoma: A systematic review and meta-analysis.Oral Oncol. 2019 Jun;93:66-75. doi: 10.1016/j.oraloncology.2019.04.019. Epub 2019 Apr 28. Oral Oncol. 2019. PMID: 31109698
-
The prognostic value of tumour-associated macrophages in Non-Hodgkin's lymphoma: A systematic review and meta-analysis.Scand J Immunol. 2020 Jan;91(1):e12814. doi: 10.1111/sji.12814. Epub 2019 Nov 14. Scand J Immunol. 2020. PMID: 31419843
Cited by
-
Tumor-associated macrophages (TAMs) as biomarkers for gastric cancer: A review.Chronic Dis Transl Med. 2018 Sep 3;4(3):156-163. doi: 10.1016/j.cdtm.2018.07.001. eCollection 2018 Sep. Chronic Dis Transl Med. 2018. PMID: 30276362 Free PMC article.
-
Platelet-to-lymphocyte ratio and lymphocyte-to-white blood cell ratio predict the efficacy of neoadjuvant chemotherapy and the prognosis of locally advanced gastric cancer patients treated with the oxaliplatin and capecitabine regimen.Onco Targets Ther. 2018 Oct 17;11:7061-7075. doi: 10.2147/OTT.S176768. eCollection 2018. Onco Targets Ther. 2018. PMID: 30410363 Free PMC article.
-
M2 Macrophage-Based Prognostic Nomogram for Gastric Cancer After Surgical Resection.Front Oncol. 2021 Aug 12;11:690037. doi: 10.3389/fonc.2021.690037. eCollection 2021. Front Oncol. 2021. PMID: 34458140 Free PMC article.
-
Tumor-infiltrating immune cells and prognosis in gastric cancer: a systematic review and meta-analysis.Oncotarget. 2017 May 3;8(37):62312-62329. doi: 10.18632/oncotarget.17602. eCollection 2017 Sep 22. Oncotarget. 2017. PMID: 28977947 Free PMC article.
-
Multiple Immune Features-Based Signature for Predicting Recurrence and Survival of Inoperable LA-NSCLC Patients.Front Oncol. 2020 Oct 14;10:571380. doi: 10.3389/fonc.2020.571380. eCollection 2020. Front Oncol. 2020. PMID: 33154945 Free PMC article.
References
-
- Chiaravalli AM, Feltri M, Bertolini V, Bagnoli E, Furlan D, Cerutti R, et al. Intratumour T cells, their activation status and survival in gastric carcinomas characterised for microsatellite instability and Epstein-Barr virus infection. Virchows Arch. 2006; 448:344–353. - PubMed
-
- Phillips SM, Banerjea A, Feakins R, Li SR, Bustin SA, Dorudi S. Tumour-infiltrating lymphocytes in colorectal cancer with microsatellite instability are activated and cytotoxic. Br J Surg. 2004; 91:469–475. - PubMed
Publication types
MeSH terms
Substances
LinkOut - more resources
Full Text Sources
Other Literature Sources
Medical
Research Materials

