. 2015 Dec 29:15:587.
doi: 10.1186/s12879-015-1318-9.

Detecting signals of seasonal influenza severity through age dynamics

Affiliations

Detecting signals of seasonal influenza severity through age dynamics

Elizabeth C Lee et al. BMC Infect Dis. .

Abstract

Background: Measures of population-level influenza severity are important for public health planning, but estimates are often based on case-fatality and case-hospitalization risks, which require multiple data sources, are prone to surveillance biases, and are typically unavailable in the early stages of an outbreak. To address the limitations of traditional indicators, we propose a novel severity index based on influenza age dynamics estimated from routine physician diagnosis data that can be used retrospectively and for early warning.

Methods: We developed a quantitative 'ground truth' severity benchmark that synthesizes multiple traditional severity indicators from publicly available influenza surveillance data in the United States. Observing that the age distribution of cases may signal severity early in an epidemic, we constructed novel retrospective and early warning severity indexes based on the relative risk of influenza-like illness (ILI) among working-age adults to that among school-aged children using weekly outpatient medical claims. We compared our relative risk-based indexes to the composite benchmark and estimated seasonal severity for flu seasons from 2001-02 to 2008-09 at the national and state levels.

Results: The severity classifications made by the benchmark were not uniquely captured by any single contributing metric, including pneumonia and influenza mortality; the influenza epidemics of 2003-04 and 2007-08 were correctly identified as the most severe of the study period. The retrospective index was well correlated with the severity benchmark and correctly identified the two most severe seasons. The early warning index performance varied, but it projected 2007-08 as relatively severe 10 weeks prior to the epidemic peak. Influenza severity varied significantly among states within seasons, and four states were identified as possible early warning sentinels for national severity.

Conclusions: Differences in age patterns of ILI may be used to characterize seasonal influenza severity in the United States in real-time and in a spatially resolved way. Future research on antigenic changes among circulating viruses, pre-existing immunity, and changing contact patterns may better elucidate the mechanisms underlying these indexes. Researchers and practitioners should consider the use of composite or ILI-based severity metrics in addition to traditional severity measures to inform epidemiological understanding and situational awareness in future seasonal outbreaks.


Figures
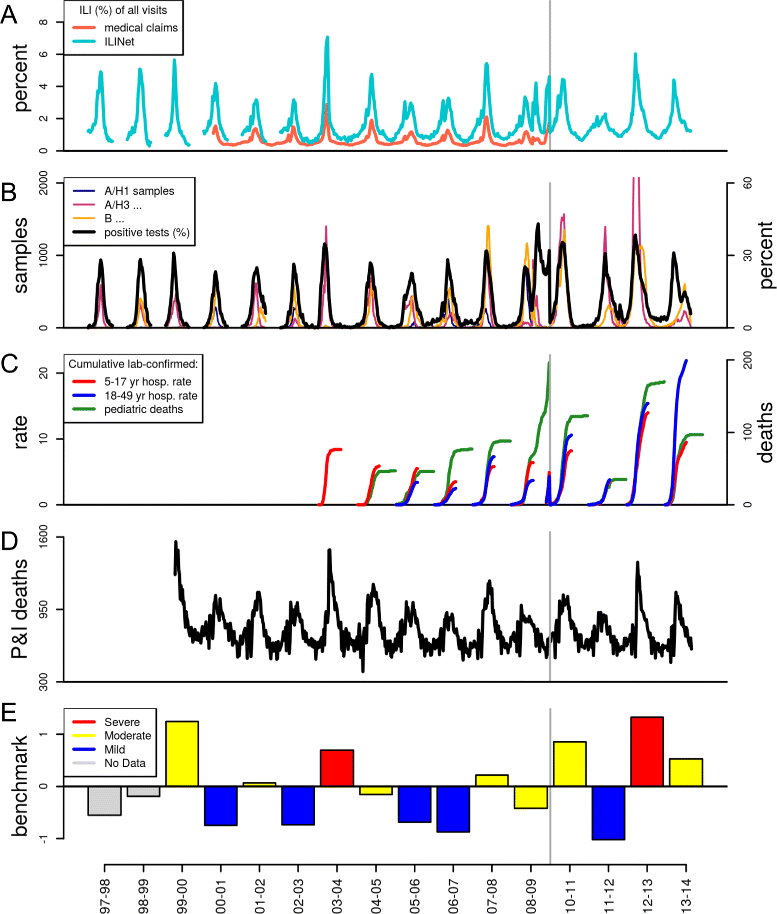
Fig. 1
Fig. 1
Influenza surveillance data in the United States for the 1997–98 to 2013–14 seasons (excluding 2009–10). Characterization of ILI activity as a function of: a ILI as a percentage of all outpatient visits in CDC’s ILINet and IMS Health medical claims data, b influenza subtype samples and percentage of laboratory-confirmed influenza specimens, c laboratory-confirmed influenza surveillance: cumulative hospitalization rates per 100,000 population for ages 5–17 and 18–49, and cumulative pediatric deaths (under 18 years old) over the course of the season, and d number of deaths attributed to pneumonia and influenza. The grey vertical line denotes a break in the time series for the period from October 2009 through September 2010; data not shown were not available. e The benchmark (β s) was constructed from surveillance data on positive percentage of influenza tests, hospitalization rates, pediatric deaths, and pneumonia and influenza deaths. Bar color corresponds to severity categories, qualitatively assigned in a textual analysis of CDC Flu Season Summaries
Fig. 2
Fig. 2
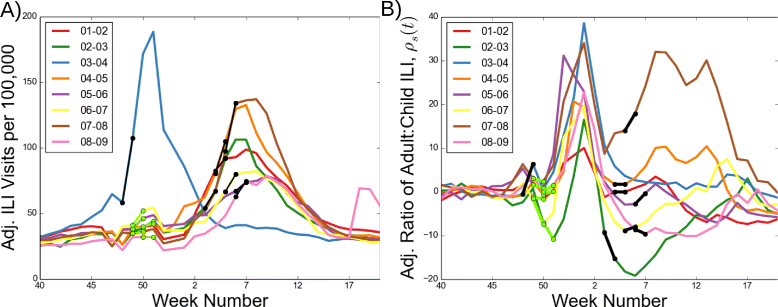
Influenza age dynamics differ from overall epidemic dynamics. a Medically attended outpatient ILI visits per 100,000 for the 2001–02 through 2008–09 flu seasons, adjusted for increasing surveillance data coverage and ILI care-seeking behavior, are displayed. The national early warning and retrospective classification periods are overlaid in green and black, respectively. b The normalized relative risk of adult ILI to child ILI rates (ρ s(t)), a proxy of age-specific disease burden, follows a regular seasonal pattern during the U.S. Thanksgiving and winter holiday periods, and diverges during the typical epidemic growth periods of January and February (around weeks 2–7)
Fig. 3
Fig. 3
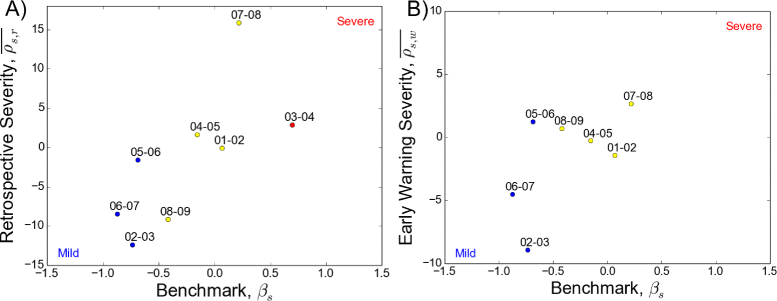
Retrospective and early warning severity indexes compared to the benchmark. a Retrospective severity (ρs,r¯) has a positive relationship with the benchmark (R= 0.71, p-value = 0.05). b Early warning severity (ρs,w¯) has a positive relationship with the benchmark (R= 0.59, p-value = 0.16). The 2003–04 season was removed because it was an early flu season and the early warning period occurred after the retrospective period. Point color corresponds to qualitatively-assigned severity category, where red is severe, yellow is moderate, and blue is mild
Fig. 4
Fig. 4
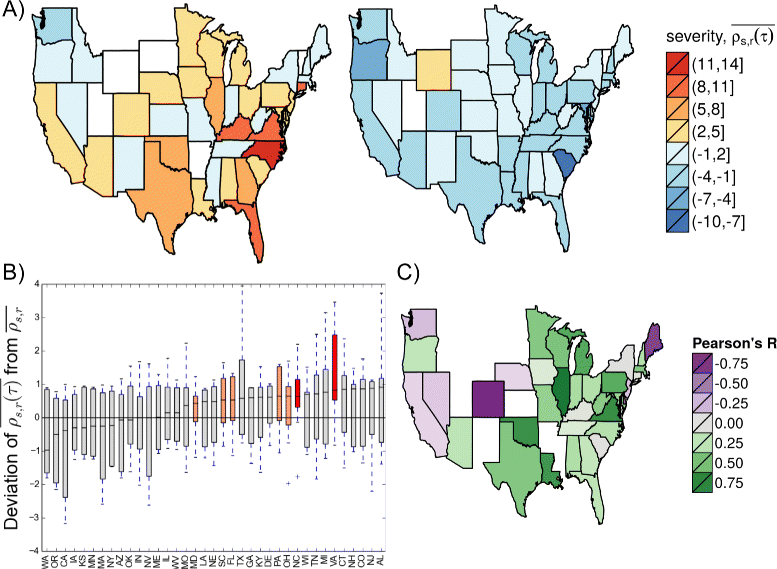
State-level patterns of seasonal influenza severity. a State retrospective severity (ρs,r(τ)¯) may range from mild to severe in a single season regardless of the national retrospective severity index (ρs,r¯). The 2007–08 (left) and 2008–09 (right) seasons, where ρs,r¯ values were 16 and -9 respectively, are displayed. States in white did not have sufficient data to calculate a retrospective severity index. b Deviation between state (ρs,r(τ)¯) and national retrospective severity (ρs,r¯) across the eight study seasons was used to identify states that tend to experience more severe flu seasons than other states. The 75th and 70th percentiles exceeded zero for red and orange highlighted states, respectively. c Pearson’s R correlation coefficients (H o:R=0) between state early warning (ρs,w(τ)¯) and national retrospective (ρs,r¯) classifications were used to suggest possible ‘sentinel’ states. Only coefficients for Illinois, Virginia, Colorado and Maine had p-values below 0.05. States in white did not have enough data to calculate at least one of the two metrics for at least one study season
Fig. 5
Fig. 5
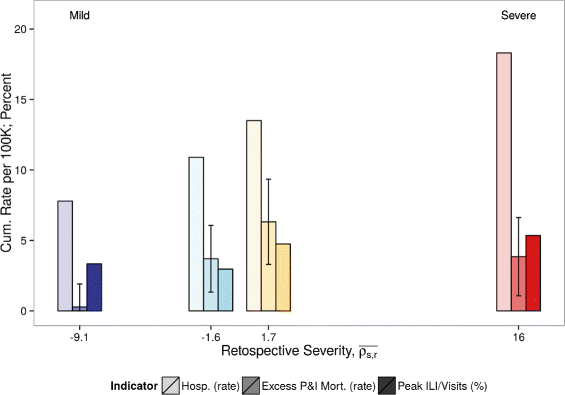
Translation of retrospective severity to operational indicators of the burden of influenza. The retrospective severity index (ρs,r¯) may be mapped to historical data on cumulative confirmed influenza-related hospitalizations per 100,000, peak week outpatient visits due to ILI (ILINet), and seasonal excess P&I mortality rates per 100,000 in order to inform decision makers about the expected range of disease burden in a given season. Error bars represent the standard deviation in state-level variation of the excess P&I mortality rate, and bar color represents a milder to more severe retrospective severity index value (dark blue to dark red)

References

    1. Hardelid P, Andrews N, Pebody R. Excess mortality monitoring in England and Wales during the influenza A(H1N1) 2009 pandemic. Epidemiol Infect. 2011;139(9):1431–9. doi: 10.1017/S0950268811000410. - DOI - PubMed
    1. Group TE. Cold exposure and winter mortality from ischaemic heart disease, cerebrovascular disease, respiratory disease, and all causes in warm and cold regions of Europe. Lancet. 1997;349:1341–6. doi: 10.1016/S0140-6736(96)12338-2. - DOI - PubMed
    1. Wolf YI, Nikolskaya A, Cherry JL, Viboud C, Koonin E, Lipman DJ. Projection of seasonal influenza severity from sequence and serological data. PLoS Curr. 2010;2:1200. doi: 10.1371/currents.RRN1200. - DOI - PMC - PubMed
    1. Simonsen L, Clarke MJ, Williamson GD, Stroup DF, Arden NH, Schonberger LB. The impact of influenza epidemics on mortality: introducing a severity index. Am J Public Health. 1997;87(12):1944–50. doi: 10.2105/AJPH.87.12.1944. - DOI - PMC - PubMed
    1. Bansal S, Pourbohloul B, Hupert N, Grenfell B, Meyers LA. The shifting demographic landscape of pandemic influenza. PLoS One. 2010;5(2):9360. doi: 10.1371/journal.pone.0009360. - DOI - PMC - PubMed

Publication types