. 2016 Mar;6(3):256-69.
doi: 10.1158/2159-8290.CD-15-0822. Epub 2015 Dec 29.

Hif1a Deletion Reveals Pro-Neoplastic Function of B Cells in Pancreatic Neoplasia

Affiliations

Hif1a Deletion Reveals Pro-Neoplastic Function of B Cells in Pancreatic Neoplasia

Kyoung Eun Lee et al. Cancer Discov. 2016 Mar.

Abstract

Pancreatic ductal adenocarcinoma (PDAC) is a leading cause of cancer-related deaths worldwide, with an exceedingly low 5-year survival rate. PDAC tumors are characterized by an extensive desmoplastic stromal response and hypovascularity, suggesting that tumor hypoxia could regulate PDAC initiation and/or progression. Using a well-defined, autochthonous Kras(G12D)-driven murine model, as well as human tumors, we demonstrate that hypoxia and stabilization of hypoxia-inducible factor 1α (HIF1α), a principal mediator of hypoxic adaptation, emerge early during preinvasive stages of PDAC. Surprisingly, pancreas-specific Hif1a deletion drastically accelerated Kras(G12D)-driven pancreatic neoplasia and was accompanied by significant increases in intrapancreatic B lymphocytes, featuring prominent influx of a rare "B1b" B-cell subtype. Finally, treatment of HIF1α-deficient mice with B cell-depleting αCD20 monoclonal antibodies inhibited progression of pancreatic intraepithelial neoplasia (PanIN). Our data reveal a previously unrecognized role for B cells in promoting pancreatic tumorigenesis and implicate HIF1α as a critical regulator of PDAC development.

Significance: We show here that pancreas-specific Hif1a deletion promotes PDAC initiation, coincident with increased intrapancreatic accumulation of B cells, and that B-cell depletion suppresses pancreatic tumorigenesis. We therefore demonstrate a protective role for HIF1α in pancreatic cancer initiation and uncover a previously unrecognized function of B cells.


Conflict of interest statement

Disclosure of potential conflicts of interest: The authors disclose no potential conflicts of interest.

Figures

Figure 1
Figure 1
Hypoxia and stabilization of HIF1α occur during PanIN development. A, Immunohistochemical staining for HIF1α or Hypoxyprobe in pancreata from WT and KrasG12D mice. Tissues are from 2-month-old WT mice with histologically normal pancreas (left), 2-month-old KrasG12D mice with areas of PanINs adjacent to areas of normal pancreas (middle), and moribund (8-22 months) KrasG12D mice with areas of invasive PDAC (right). Dashed lines and arrows denote fibroin flammatory area. Arrowheads indicate PanIN. Corresponding quantification is indicated in the graph (n = 5 WT, n = 5KrasG12D PanIN, n = 4KrasG12D PDAC, n = 3 FOV per animal for HIF1α;n = 4 WT, n = 4KrasG12D PanIN, n = 5KrasG12D PDAC, n = 3 FOV per animal for Hypoxyprobe). FOV, fields of view. B, HIF1α immunohistochemical staining in representative samples of human normal pancreatic (left), PanIN (middle), and PDAC (right) tissues. Arrowheads indicate PanIN. Corresponding quantification is indicated in the graph (n = 7 normal, n = 24 PDAC). Scale bars (A,B), 100 μm. The data in A,B are shown as the mean ± s.e.m. P values were determined by Mann-Whitney test. ***P < 0.001, ****P< 0.0001.
Figure 2
Figure 2
Deletion of Hif1α in the pancreas accelerates initiation and progression of PanINs. A, H&E staining of pancreata from 1-month-old Hif1αfl/fl and p48-Cre;Hif1αfl/fl (Hif1αKO) mice. Scale bars, 300 μm. B, H&E or Alcian blue staining of pancreatic tissue sections from 2-month-old KrasG12D and KrasG12D;Hif1αKO mice. Scale bars, 200 μm. C, Quantification of histological progression of PanINs in 2-month-old KrasG12D and KrasG12D;Hif1αKO mice. Ten high power fields (HPF) were analyzed per animal (n = 7 KrasG12D, n = 8 KrasG12D;Hif1αKO). ND, not detected. D, Immunohistochemical staining for CD45 or Masson's trichrome staining for collagen deposition in pancreata from 2-month-old KrasG12D and KrasG12D;Hif1αKO mice. Insets show higher magnified view of the same field. Scale bars, 200 μm. E, Immunohistochemical staining for Ki67, cleaved Caspase-3 (cCasp3), or CD31 in pancreata from 2-month-old KrasG12D and KrasG12D;Hif1αKO mice and corresponding quantification (n = 6 KrasG12D, n = 5 KrasG12D;Hif1αKO, n = 10 FOV per animal for Ki67; n = 7 KrasG12D, n = 8 KrasG12D;Hif1αKO, n = 5 FOV per animal for cCasp3; n = 8 KrasG12D, n = 9 KrasG12D;Hif1αKO, n = 3 FOV per animal for CD31). FOV, fields of view. Scale bars, 100 μm. F, Quantitative RT-PCR analysis of Vegfa in pancreata from 2-month-old KrasG12D and KrasG12D;Hif1αKO mice (n = 8 KrasG12D, n = 9 KrasG12D;Hif1αKO). The data in C,E,F are shown as the mean ± s.e.m. P values were determined by Mann-Whitney test. NS, not significant. *P< 0.05, **P< 0.01, ***P< 0.001.
Figure 3
Figure 3
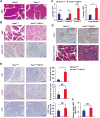
Elimination of HIF1α promotes intrapancreatic accumulation of B cells. A-C, Flow cytometry analysis of pancreatic immune infiltrates from 2-month-old KrasG12D and KrasG12D;Hif1αKO mice. A, Absolute numbers of CD45+ immunecells (n = 6 KrasG12D, n = 8 KrasG12D;Hif1αKO). B, Percentage of F4/80+ macrophages (MΦ), Gr1+CD11b+ myeloid-derived suppressor cells (MDSC), CD11c+F4/80- dendritic cells (DC), CD3+ T cells (T), and CD19+ B cells (B)amongliveCD45+ immunecells (n = 9KrasG12D, n = 9 KrasG12D;Hif1αKO). C, Absolute numbers of CD19+ B cells (n = 6 KrasG12D, n = 8 KrasG12D;Hif1αKO). D, Immunohistochemical staining for CD19 or B220 in pancreata from 2-month-old KrasG12D and KrasG12D;Hif1αKO mice. E, Immunohistochemical staining of CD20 in representative samples of human PDAC containing PanIN lesions. F, Representative photographs of spleens from 2-month-old KrasG12Dand KrasG12D;Hif1αKO mice. G, Relative spleen weight normalized to body weight in 2-month-old KrasG12D and KrasG12D;Hif1αKO mice (n = 12 KrasG12D, n = 11 KrasG12D;Hif1αKO). H, Absolute numbers of CD19+ B cells in spleens quantified by flow cytometry (n = 8 KrasG12D, n = 10 KrasG12D;Hif1αKO). Scale bars (D,E), 100 μm. The symbols in A-C,H representindividual mice, and horizontal lines represent the means. The data in G are shown as the mean ± s.e.m. P values were determined by Mann-Whitney test. *P< 0.05, **P< 0.01, ****P< 0.0001.
Figure 4
Figure 4
Characterization of B cell subpopulations in KrasG12D and KrasG12D;Hif1αKO pancreata. A-C, B cell subsets in pancreata from 2-month-old WT, KrasG12D, and KrasG12D;Hif1αKO mice as evaluated by flow cytometry. Live CD19+ B cells were sub-gated to determine the percentage of CD43-CD5- B2 cells (A), CD43+IgMhi B1 cells (B), and CD19hiCD1dhiCD5+regulatory B cells (Breg) (C) among total B cells. B1 cells were further subdivided into B1a (CD5+) and B1b (CD5-). Numbers in plots show mean frequencies of the indicated subsets among CD19+ B cells (n = 6 WT, n = 8 KrasG12D, n = 10 KrasG12D;Hif1αKO). The symbols represent individual mice, and horizontal lines represent the means. P values were determined by Mann-Whitney test. NS, not significant. *P< 0.05, **P< 0.01, ***P< 0.001.
Figure 5
Figure 5
B cell depletion results in delayed progression of PanINs. A-F, KrasG12D and KrasG12D;Hif1αKO mice treated with isotype control antibody or αCD20 mAb (10 mg/kg at 2-week-old and 5 mg/kg thereafter at 2-week intervals until 10 weeks of age) and analyzed at 12 weeks of age. A-C, Absolute numbers of CD19+ B cells in the pancreas (A) and spleen (B) nd the percentage of CD19+ B cells in peripheral blood among live CD45+ immune cells (C) as analyzed by flow cytometry (n = 10KrasG12D + IgG2a, n = 9 KrasG12D+ αCD20, n = 13KrasG12D;Hif1αKO+ IgG2a, n = 9 KrasG12D;Hif1αKO+ αCD20). D, H&E staining of pancreata. Scale bars, 300 μm. E, Quantification of histological progression of PanINs. Ten high power fields (HPF) were analyzed per animal (n = 10 KrasG12D + IgG2a, n = 11 KrasG12D + αCD20, n = 9 KrasG12D;Hif1αKO+ IgG2a, n = 9 KrasG12D;Hif1αKO + αCD20). F, Percentage of animals displaying areas of microinvasive neoplasms (n = 9 KrasG12D + IgG2a, n = 9 KrasG12D + αCD20, n = 13 KrasG12D;Hif1αKO+ IgG2a, n = 9 KrasG12D;Hif1αKO + αCD20). The symbols in A-Crepresent individual mice, and horizontal lines represent the means. The data in E are shown as the mean ± s.e.m. P values were determined by Mann-Whitney test (A-C,E) or Fisher's exact test (F). *P< 0.05, **P< 0.01, ***P< 0.001, ****P< 0.0001.
Figure 6
Figure 6
HIF1α deficiency is concomitant with increased CXCL13 expression. A, Immunohistochemical staining for CXCL13 in pancreata from 2-month-old WT, KrasG12D, and KrasG12D;Hif1αKO mice. B and C, Enzyme-linked immunosorbent assay (ELISA) (B) or quantitative RT-PCR analysis (C) of CXCL13 in pancreata from 2-month-old WT, KrasG12D, and KrasG12D;Hif1αKO mice(n = 11 WT, n = 10 KrasG12D, n = 11KrasG12D;Hif1αKO for B; n = 9 WT, n = 8 KrasG12D, n = 9 KrasG12D;Hif1αKO for C). D, Immunohistochemical staining for CXCL13 in representative samples of human PDAC. E, Quantitative RT-PCR analysis of the indicated chemokines in pancreata from 2-month-old WT, KrasG12D, and KrasG12D;Hif1αKO mice (n = 8 WT, n = 12 KrasG12D, n = 12 KrasG12D;Hif1αKO). Scale bars (A,D), 100 μm. The data in B,C,E are shown as the mean ± s.e.m. P values were determined by Mann-Whitney test. *P< 0.05, **P< 0.01, ***P< 0.001.

Comment in

References

    1. Siegel R, Ma J, Zou Z, Jemal A. Cancer statistics, 2014. CA: a cancer journal for clinicians. 2014;64:9–29. - PubMed
    1. Vincent A, Herman J, Schulick R, Hruban RH, Goggins M. Pancreatic cancer. Lancet. 2011;378:607–20. - PMC - PubMed
    1. Kanda M, Matthaei H, Wu J, Hong SM, Yu J, Borges M, et al. Presence of somatic mutations in most early-stage pancreatic intraepithelial neoplasia. Gastroenterology. 2012;142:730–3 e9. - PMC - PubMed
    1. Waddell N, Pajic M, Patch AM, Chang DK, Kassahn KS, Bailey P, et al. Whole genomes redefine the mutational landscape of pancreatic cancer. Nature. 2015;518:495–501. - PMC - PubMed
    1. Hingorani SR, Petricoin EF, Maitra A, Rajapakse V, King C, Jacobetz MA, et al. Preinvasive and invasive ductal pancreatic cancer and its early detection in the mouse. Cancer cell. 2003;4:437–50. - PubMed

Publication types

MeSH terms

Substances