

Reconciling Differences in Pool-GWAS Between Populations: A Case Study of Female Abdominal Pigmentation in Drosophila melanogaster
- PMID: 26715669
- PMCID: PMC4788253
- DOI: 10.1534/genetics.115.183376
Reconciling Differences in Pool-GWAS Between Populations: A Case Study of Female Abdominal Pigmentation in Drosophila melanogaster
Abstract
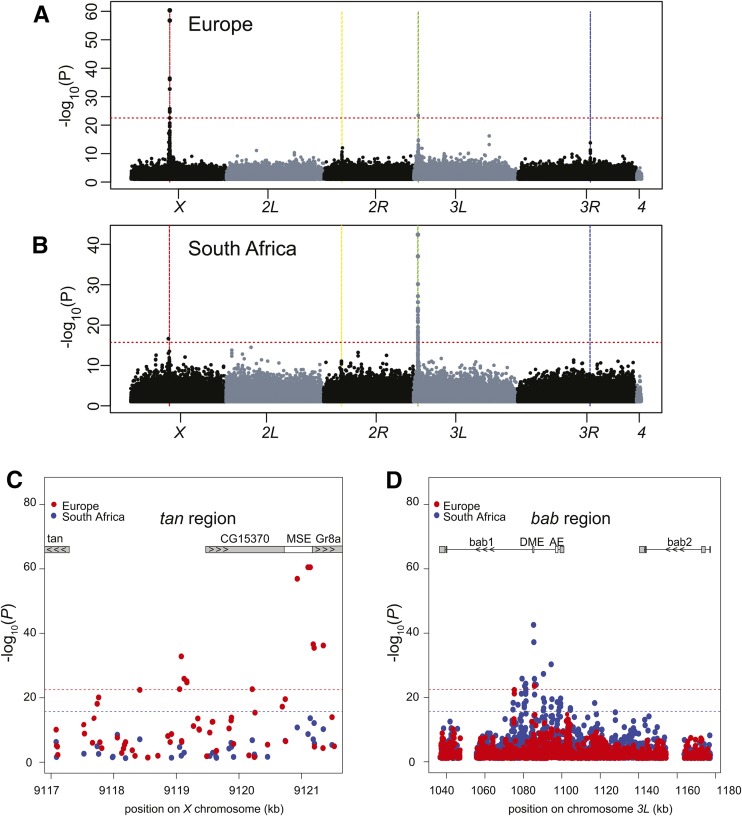
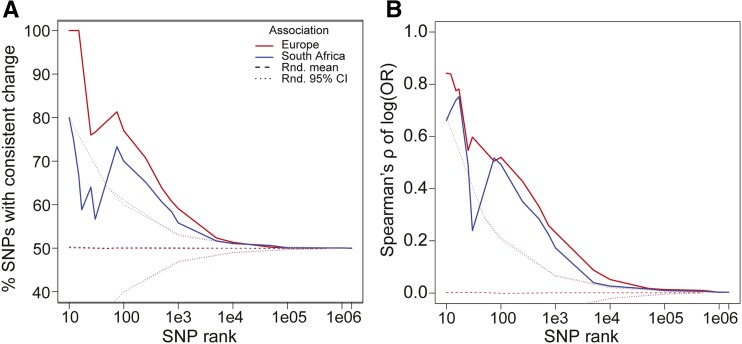
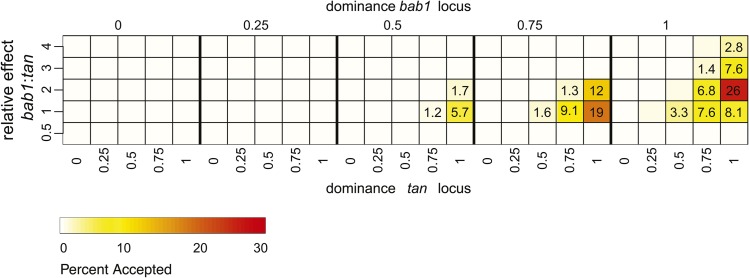
The degree of concordance between populations in the genetic architecture of a given trait is an important issue in medical and evolutionary genetics. Here, we address this problem, using a replicated pooled genome-wide association study approach (Pool-GWAS) to compare the genetic basis of variation in abdominal pigmentation in female European and South African Drosophila melanogaster. We find that, in both the European and the South African flies, variants near the tan and bric-à-brac 1 (bab1) genes are most strongly associated with pigmentation. However, the relative contribution of these loci differs: in the European populations, tan outranks bab1, while the converse is true for the South African flies. Using simulations, we show that this result can be explained parsimoniously, without invoking different causal variants between the populations, by a combination of frequency differences between the two populations and dominance for the causal alleles at the bab1 locus. Our results demonstrate the power of cost-effective, replicated Pool-GWAS to shed light on differences in the genetic architecture of a given trait between populations.
Keywords: Drosophila melanogaster; GWAS; dominance; genome-wide association study; pigmentation; pooled sequencing.
Copyright © 2016 by the Genetics Society of America.
Figures
Similar articles
-
A genome-wide, fine-scale map of natural pigmentation variation in Drosophila melanogaster.PLoS Genet. 2013 Jun;9(6):e1003534. doi: 10.1371/journal.pgen.1003534. Epub 2013 Jun 6. PLoS Genet. 2013. PMID: 23754958 Free PMC article.
-
Genetic basis of natural variation in body pigmentation in Drosophila melanogaster.Fly (Austin). 2015;9(2):75-81. doi: 10.1080/19336934.2015.1102807. Fly (Austin). 2015. PMID: 26554300 Free PMC article.
-
Genetic Architecture of Abdominal Pigmentation in Drosophila melanogaster.PLoS Genet. 2015 May 1;11(5):e1005163. doi: 10.1371/journal.pgen.1005163. eCollection 2015 May. PLoS Genet. 2015. PMID: 25933381 Free PMC article.
-
The Genetic Basis of Pigmentation Differences Within and Between Drosophila Species.Curr Top Dev Biol. 2016;119:27-61. doi: 10.1016/bs.ctdb.2016.03.004. Epub 2016 Apr 25. Curr Top Dev Biol. 2016. PMID: 27282023 Free PMC article. Review.
-
Charting the genotype-phenotype map: lessons from the Drosophila melanogaster Genetic Reference Panel.Wiley Interdiscip Rev Dev Biol. 2018 Jan;7(1):10.1002/wdev.289. doi: 10.1002/wdev.289. Epub 2017 Aug 22. Wiley Interdiscip Rev Dev Biol. 2018. PMID: 28834395 Free PMC article. Review.
Cited by
-
Genomic basis for drought resistance in European beech forests threatened by climate change.Elife. 2021 Jun 16;10:e65532. doi: 10.7554/eLife.65532. Elife. 2021. PMID: 34132196 Free PMC article.
-
A Variable Genetic Architecture of Melanic Evolution in Drosophila melanogaster.Genetics. 2016 Nov;204(3):1307-1319. doi: 10.1534/genetics.116.192492. Epub 2016 Sep 16. Genetics. 2016. PMID: 27638419 Free PMC article.
-
Genetic architecture of a body colour cline in Drosophila americana.Mol Ecol. 2020 Aug;29(15):2840-2854. doi: 10.1111/mec.15531. Epub 2020 Jul 13. Mol Ecol. 2020. PMID: 32603541 Free PMC article.
-
The Genomic Architecture of Flowering Time Varies Across Space and Time in Mimulus guttatus.Genetics. 2017 Jul;206(3):1621-1635. doi: 10.1534/genetics.117.201483. Epub 2017 Apr 28. Genetics. 2017. PMID: 28455350 Free PMC article.
-
Many ways to make darker flies: Intra- and interspecific variation in Drosophila body pigmentation components.Ecol Evol. 2021 May 25;11(12):8136-8155. doi: 10.1002/ece3.7646. eCollection 2021 Jun. Ecol Evol. 2021. PMID: 34188876 Free PMC article.
References
-
- Capy P., David J., Robertson A., 1988. Thoracic trident pigmentation in natural populations of Drosophila simulans: a comparison with D. melanogaster. Heredity 61: 263–268.
Publication types
MeSH terms
Grants and funding
LinkOut - more resources
Full Text Sources
Other Literature Sources
Molecular Biology Databases
