

Regulatory mechanisms of group distributions in a gregarious arthropod
- PMID: 26715999
- PMCID: PMC4680614
- DOI: 10.1098/rsos.150428
Regulatory mechanisms of group distributions in a gregarious arthropod
Abstract
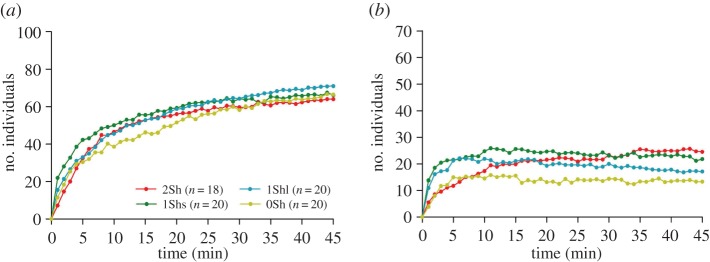
In a patchy environment, how social animals manage conspecific and environmental cues in their choice of habitat is a leading issue for understanding their spatial distribution and their exploitation of resources. Here, we experimentally tested the effects of environmental heterogeneities (artificial shelters) and some of their characteristics (size and fragmentation) on the aggregation process of a common species of terrestrial isopod (Crustacea). One hundred individuals were introduced into three different heterogeneous set-ups and in a homogeneous set-up. In the four set-ups, the populations split into two aggregates: one large (approx. 70 individuals) and one smaller (approx. 20 individuals). These aggregates were not randomly distributed in the arena but were formed diametrically opposite from one another. The similarity of the results among the four set-ups shows that under experimental conditions, the environmental heterogeneities have a low impact on the aggregation dynamics and spatial patterns of the isopod, merely serving to increase the probability of nucleation of the larger aggregation at these points. By contrast, the regulation of aggregate sizes and the regular distribution of groups are signatures of local amplification processes, in agreement with the short-range activator and long-range inhibitor model (scale-dependent feedbacks). In other words, we show how small-scale interactions may govern large-scale spatial patterns. This experimental illustration of spatial self-organization is an important step towards comprehension of the complex game of competition among groups in social species.
Keywords: aggregation; group size; local activation/long-range inhibition mechanism; patchy environment; scale-dependent feedbacks.
Figures


References
-
- Wiens JA. 1976. Population response to patchy environments. Annu. Rev. Ecol. Syst. 7, 81–129. (doi:10.1146/annurev.es.07.110176.000501) - DOI
-
- Cassini MH. 2013. Distribution ecology, from individual habitat use to species biogeographical range. New York, NY: Springer.
-
- Bowler DE, Benton TG. 2005. Causes and consequences of animal dispersal strategies: relating individual behaviour to spatial dynamics. Biol. Rev. 80, 205–225. (doi:10.1017/S1464793104006645) - DOI - PubMed
-
- Jeanson R, Deneubourg J-L. 2007. Conspecific attraction and shelter selection in gregarious insects. Am. Nat. 170, 47–58. (doi:10.1086/518570) - DOI - PubMed
-
- Valone TJ. 2007. From eavesdropping on performance to copying the behavior of others: a review of public information use. Behav. Ecol. Sociobiol. 62, 1–14. (doi:10.1007/s00265-007-0439-6) - DOI
LinkOut - more resources
Full Text Sources
Other Literature Sources
