

Synergistic effect of therapeutic stem cells expressing cytosine deaminase and interferon-beta via apoptotic pathway in the metastatic mouse model of breast cancer
- PMID: 26716512
- PMCID: PMC4868735
- DOI: 10.18632/oncotarget.6719
Synergistic effect of therapeutic stem cells expressing cytosine deaminase and interferon-beta via apoptotic pathway in the metastatic mouse model of breast cancer
Abstract
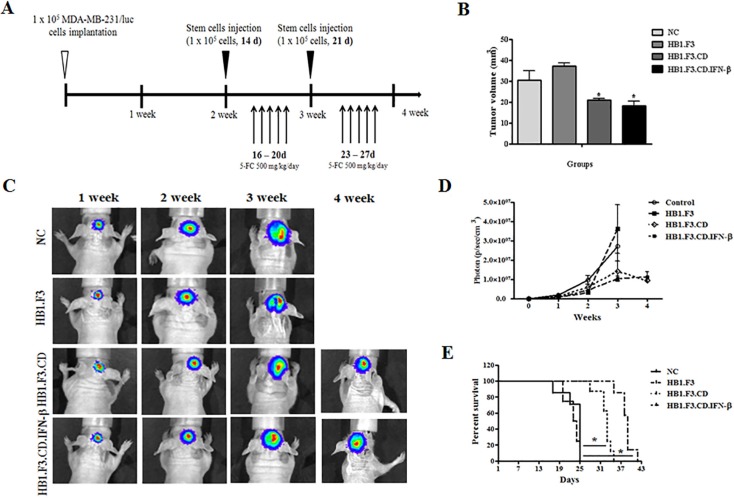
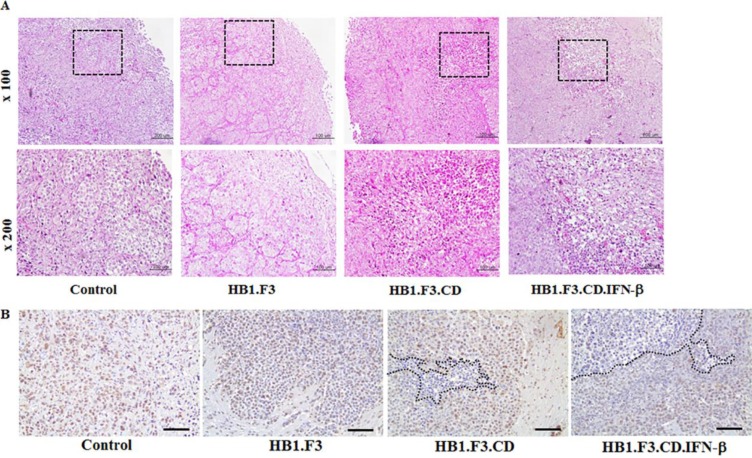
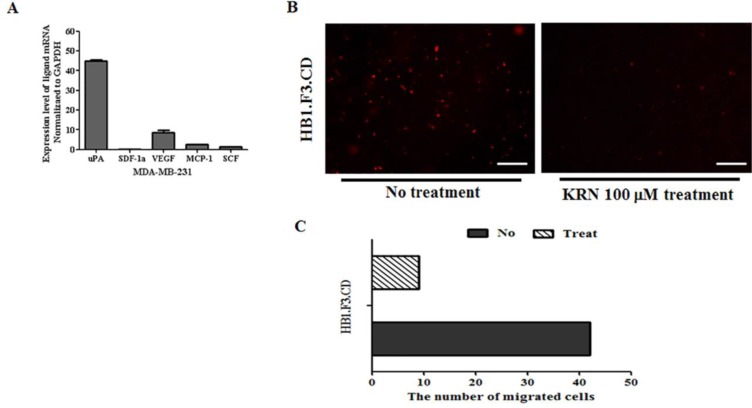
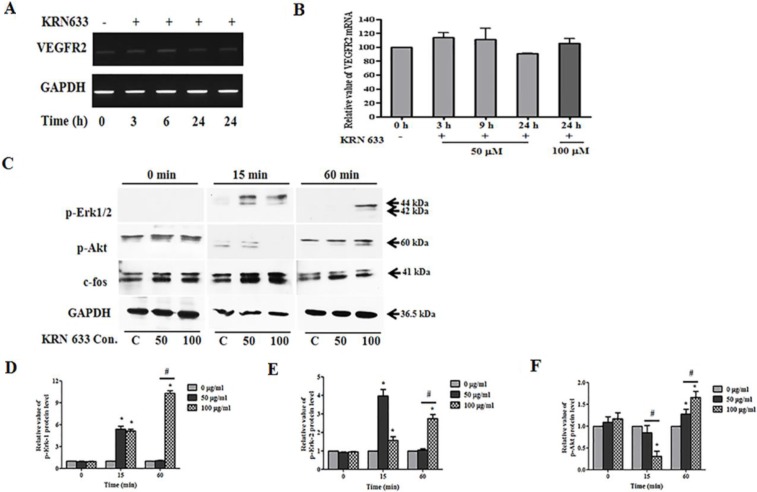
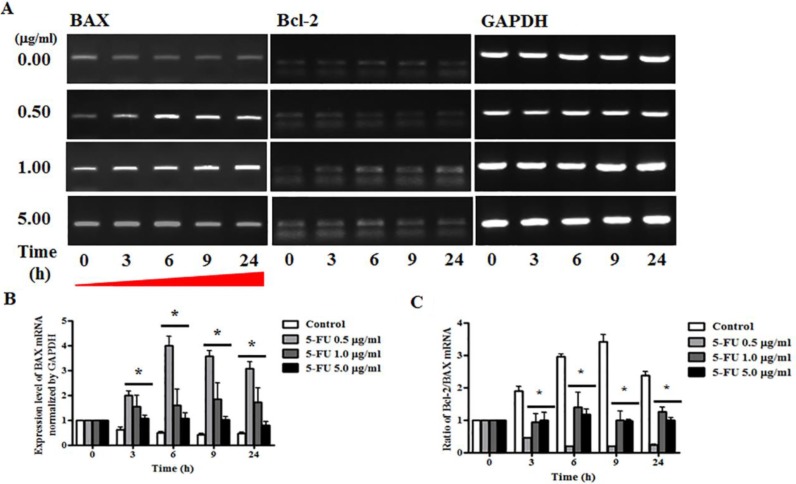
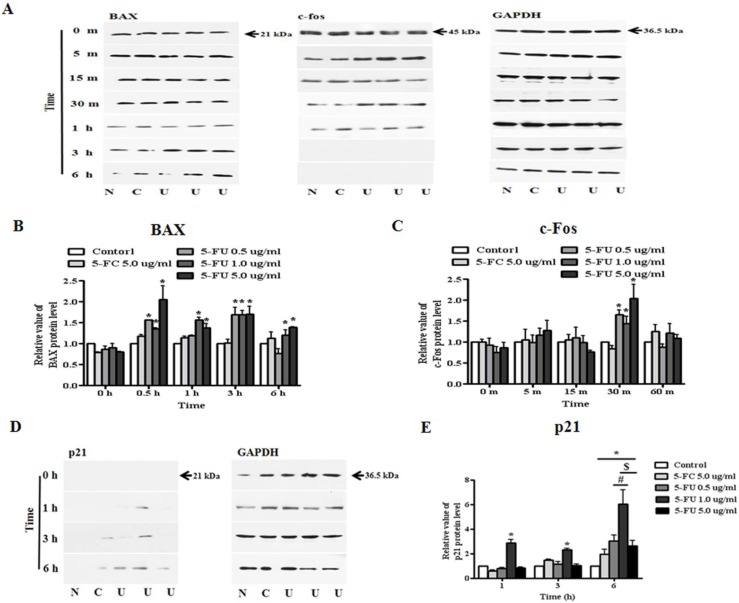
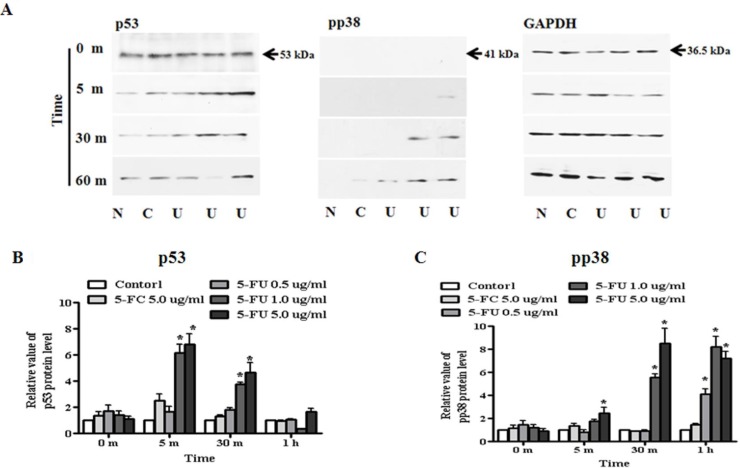
As an approach to improve treatment of breast cancer metastasis to the brain, we employed genetically engineered stem cells (GESTECs, HB1.F3 cells) consisting of neural stem cells (NSCs) expressing cytosine deaminase and the interferon-beta genes, HB1.F3.CD and HB1.F3.CD.IFN-β. In this model, MDA-MB-231/Luc breast cancer cells were implanted in the right hemisphere of the mouse brain, while pre-stained GESTECs with redfluorescence were implanted in the contralateral brain. Two days after stem cells injection, 5-fluorocytosine (5-FC) was administrated via intraperitoneal injection. Histological analysis of extracted brain confirmed the therapeutic efficacy of GESTECs in the presence of 5-FC based on reductions in density and aggressive tendency of breast cancer cells, as well as pyknosis, karyorrhexis, and karyolysis relative to a negative control. Additionally, expression of PCNA decreased in the stem cells treated group. Treatment of breast cancer cells with 5-fluorouracil (5-FU) increased the expression of pro-apoptotic and anti-proliferative factor, BAX and p21 protein through phosphorylation of p53 and p38. Moreover, analysis of stem cell migratory ability revealed that MDA-MB-231 cells endogenously secreted VEGF, and stem cells expressed their receptor (VEGFR2). To confirm the role of VEGF/VEGFR2 signaling in tumor tropism of stem cells, samples were treated with the VEGFR2 inhibitor, KRN633. The number of migrated stem cells decreased significantly in response to KRN633 due to Erk1/2 activation and PI3K/Akt inhibition. Taken together, these results indicate that treatment with GESTECs, particularly HB1.F3.CD.IFN-β co-expressing CD.IFN-β, may be a useful strategy for treating breast cancer metastasis to the brain in the presence of a prodrug.
Keywords: 5-fluorocytosine; breast cancer; interferon-beta; metastasis; stem cell therapy.
Conflict of interest statement
The authors do not have any conflicts of interest to declare.
Figures

Similar articles
-
Selective antitumor effect of neural stem cells expressing cytosine deaminase and interferon-beta against ductal breast cancer cells in cellular and xenograft models.Stem Cell Res. 2014 Jan;12(1):36-48. doi: 10.1016/j.scr.2013.09.010. Epub 2013 Oct 1. Stem Cell Res. 2014. PMID: 24141111
-
Antitumor effects of genetically engineered stem cells expressing yeast cytosine deaminase in lung cancer brain metastases via their tumor-tropic properties.Oncol Rep. 2012 Jun;27(6):1823-8. doi: 10.3892/or.2012.1721. Epub 2012 Mar 13. Oncol Rep. 2012. PMID: 22426744
-
Synergistic effects of genetically engineered stem cells expressing cytosine deaminase and interferon-β via their tumor tropism to selectively target human hepatocarcinoma cells.Cancer Gene Ther. 2012 Sep;19(9):644-51. doi: 10.1038/cgt.2012.45. Epub 2012 Jul 13. Cancer Gene Ther. 2012. PMID: 22790964
-
Therapeutic potential of stem cells expressing suicide genes that selectively target human breast cancer cells: evidence that they exert tumoricidal effects via tumor tropism (review).Int J Oncol. 2012 Sep;41(3):798-804. doi: 10.3892/ijo.2012.1523. Epub 2012 Jun 20. Int J Oncol. 2012. PMID: 22736197 Free PMC article. Review.
-
Genetically engineered bifidobacterium as a drug delivery system for systemic therapy of metastatic breast cancer patients.Breast Cancer. 2006;13(1):27-31. doi: 10.2325/jbcs.13.27. Breast Cancer. 2006. PMID: 16518059 Review.
Cited by
-
Recent advances in stem cells therapy: A focus on cancer, Parkinson's and Alzheimer's.J Genet Eng Biotechnol. 2018 Dec;16(2):427-432. doi: 10.1016/j.jgeb.2018.09.002. Epub 2018 Dec 10. J Genet Eng Biotechnol. 2018. PMID: 30733756 Free PMC article. Review.
-
Need for Specialized Therapeutic Stem Cells Banks Equipped with Tumor Regression Enzymes and Anti-Tumor Genes.J Biomed Allied Res. 2020 Jun;2(1):013. doi: 10.37191/mapsci-2582-4937-2(1)-013. Epub 2020 Mar 16. J Biomed Allied Res. 2020. PMID: 33554055 Free PMC article.
-
Converging frontiers in cancer treatment: the role of nanomaterials, mesenchymal stem cells, and microbial agents-challenges and limitations.Discov Oncol. 2024 Dec 21;15(1):818. doi: 10.1007/s12672-024-01590-0. Discov Oncol. 2024. PMID: 39707033 Free PMC article. Review.
-
Mesenchymal stromal cells for bone sarcoma treatment: Roadmap to clinical practice.J Bone Oncol. 2019 Mar 19;16:100231. doi: 10.1016/j.jbo.2019.100231. eCollection 2019 Jun. J Bone Oncol. 2019. PMID: 30956944 Free PMC article. Review.
-
Recent Progress of Stem Cell Therapy in Cancer Treatment: Molecular Mechanisms and Potential Applications.Cells. 2020 Feb 28;9(3):563. doi: 10.3390/cells9030563. Cells. 2020. PMID: 32121074 Free PMC article. Review.
References
-
- Stanisavljevic J, Loubat-Casanovas J, Herrera M, Luque T, Pena R, Lluch A, Albanell J, Bonilla F, Rovira A, Pena C, Navajas D, Rojo F, Garcia de Herreros A, et al. Snail1-expressing fibroblasts in the tumor microenvironment display mechanical properties that support metastasis. Cancer Res. 2015;75:284–295. - PubMed
-
- Muller A, Homey B, Soto H, Ge N, Catron D, Buchanan ME, McClanahan T, Murphy E, Yuan W, Wagner SN, Barrera JL, Mohar A, Verastegui E, et al. Involvement of chemokine receptors in breast cancer metastasis. Nature. 2001;410:50–56. - PubMed
-
- Chambers AF, Groom AC, MacDonald IC. Dissemination and growth of cancer cells in metastatic sites. Nat Rev Cancer. 2002;2:563–572. - PubMed
-
- Eichler AF, Loeffler JS. Multidisciplinary management of brain metastases. Oncologist. 2007;12:884–898. - PubMed
Publication types
MeSH terms
Substances
LinkOut - more resources
Full Text Sources
Other Literature Sources
Medical
Research Materials
Miscellaneous
