. 2016 Jan 26;7(4):4122-41.
doi: 10.18632/oncotarget.6702.

Autophagy is involved in TGF-β1-induced protective mechanisms and formation of cancer-associated fibroblasts phenotype in tumor microenvironment

Affiliations

Autophagy is involved in TGF-β1-induced protective mechanisms and formation of cancer-associated fibroblasts phenotype in tumor microenvironment

Fang-Lan Liu et al. Oncotarget. .

Abstract

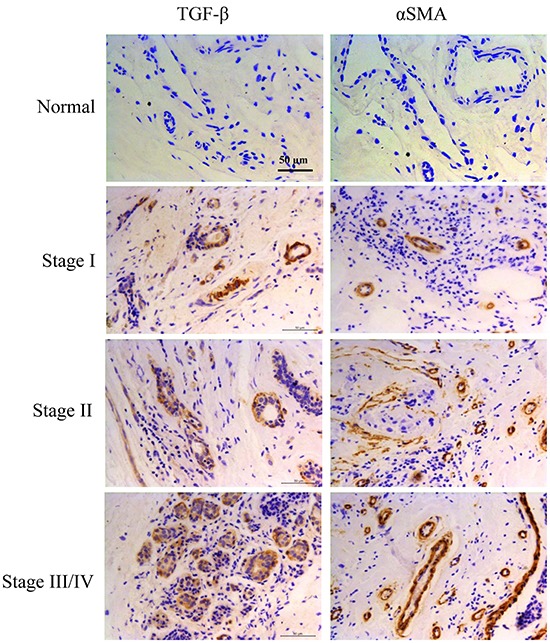
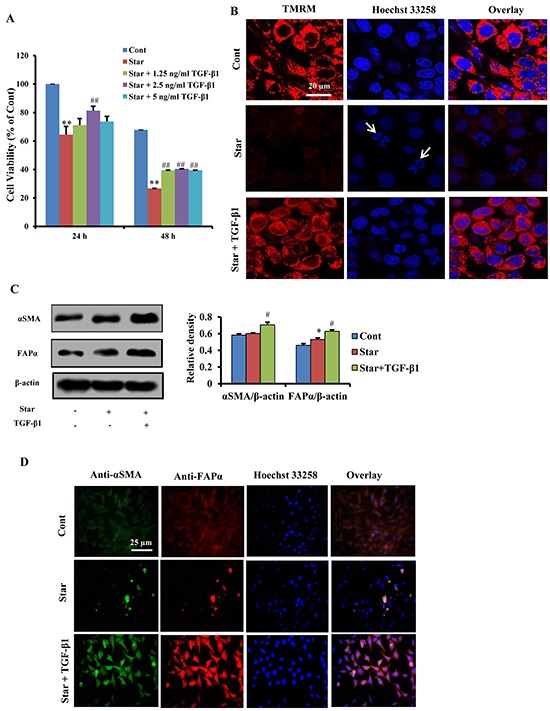
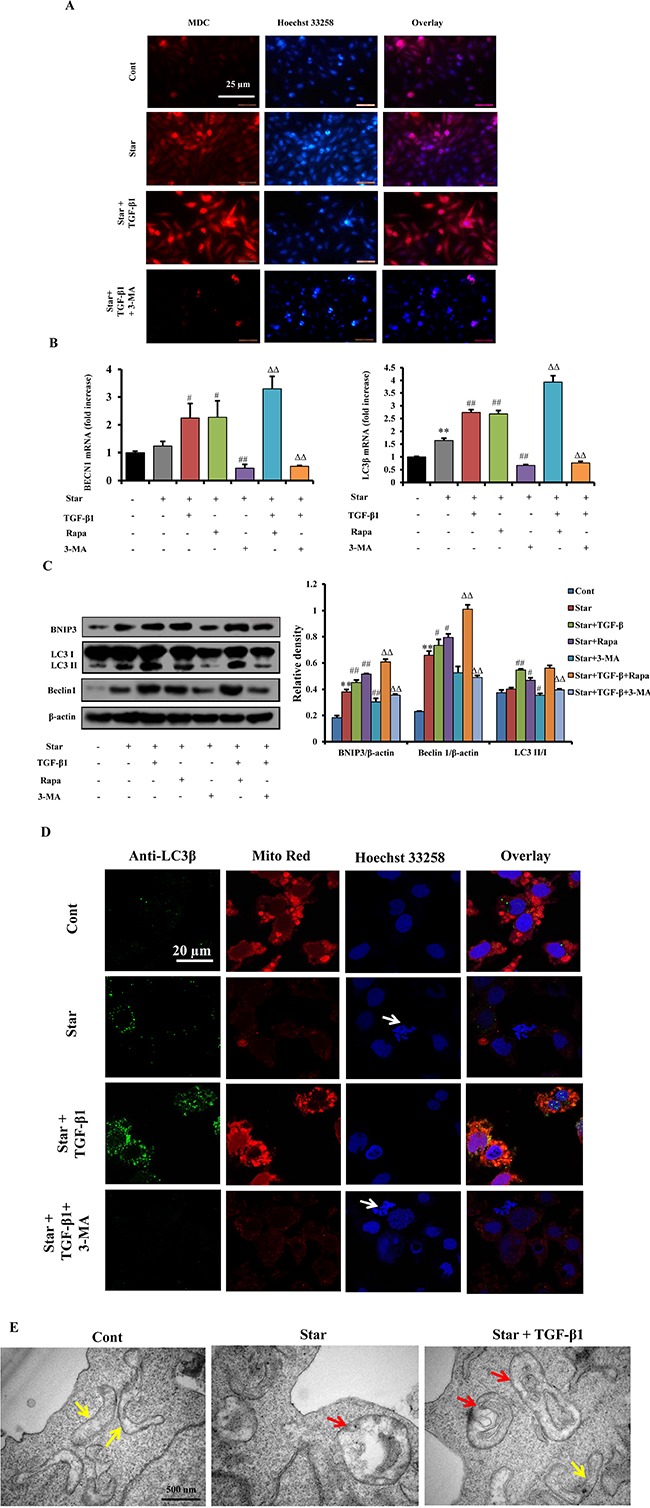
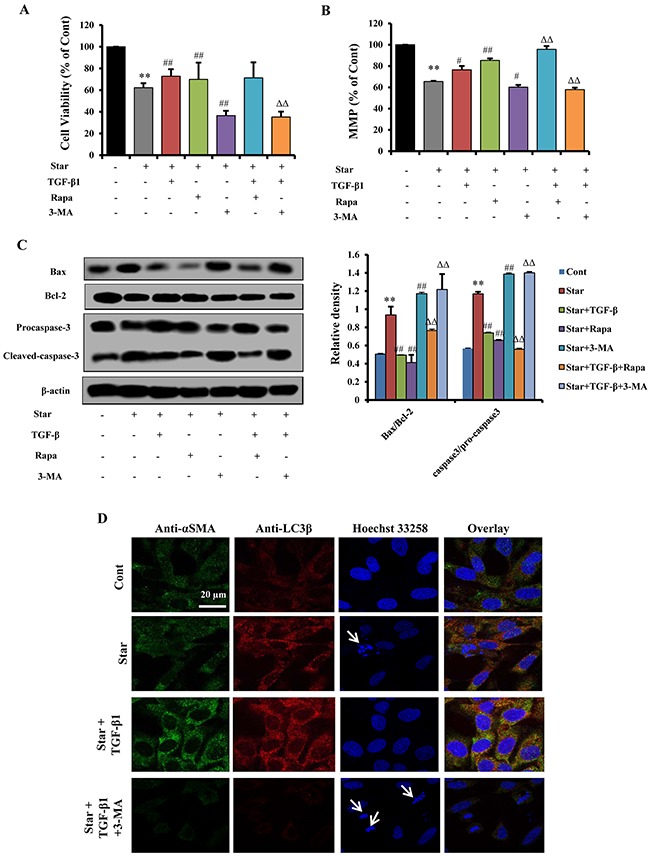
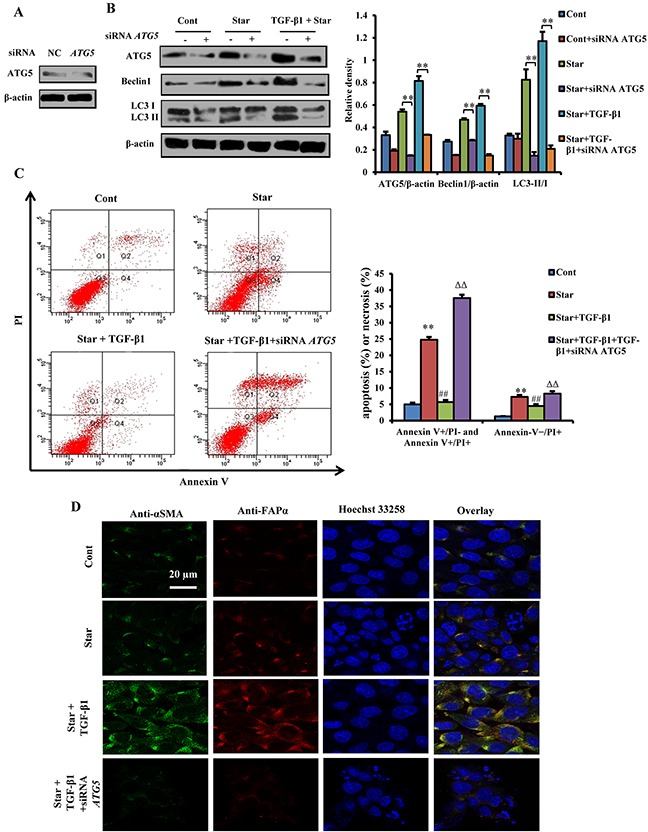
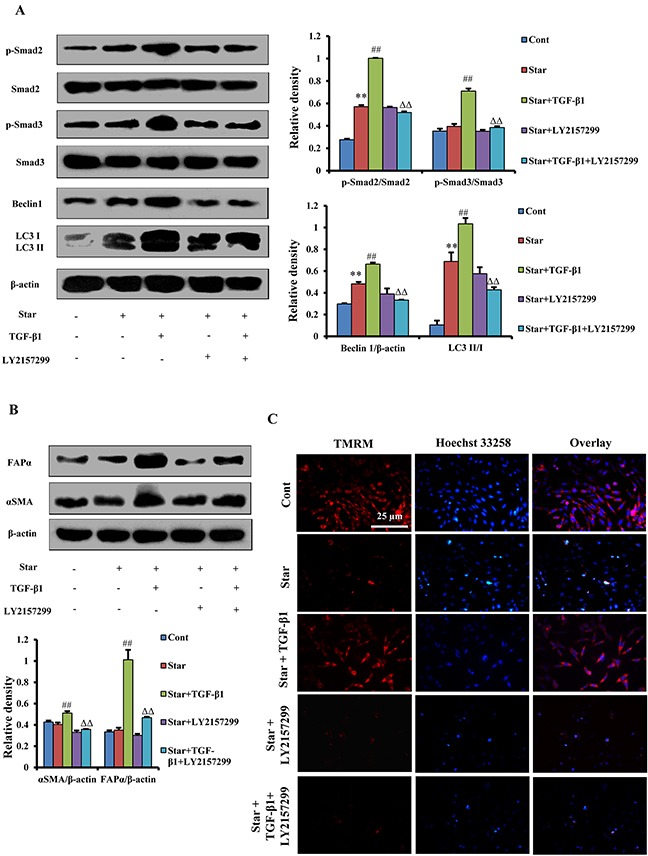
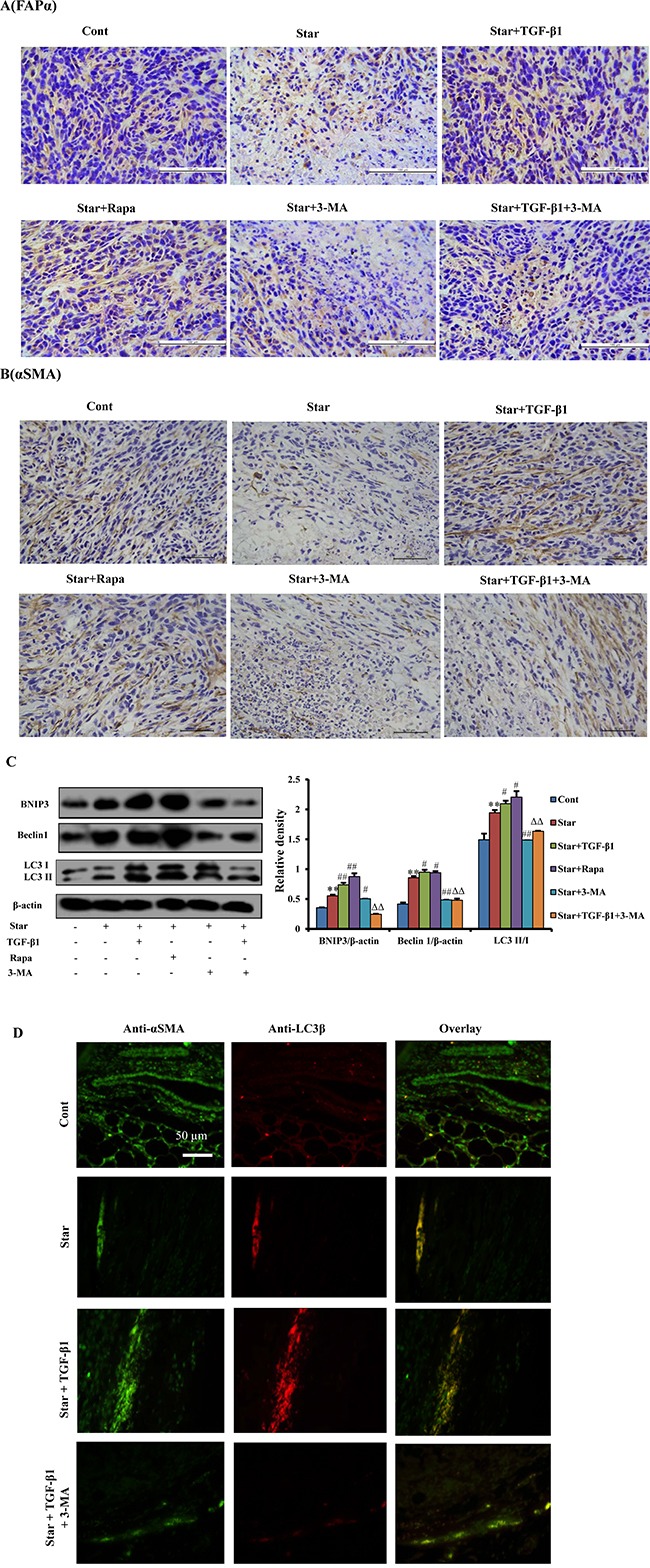
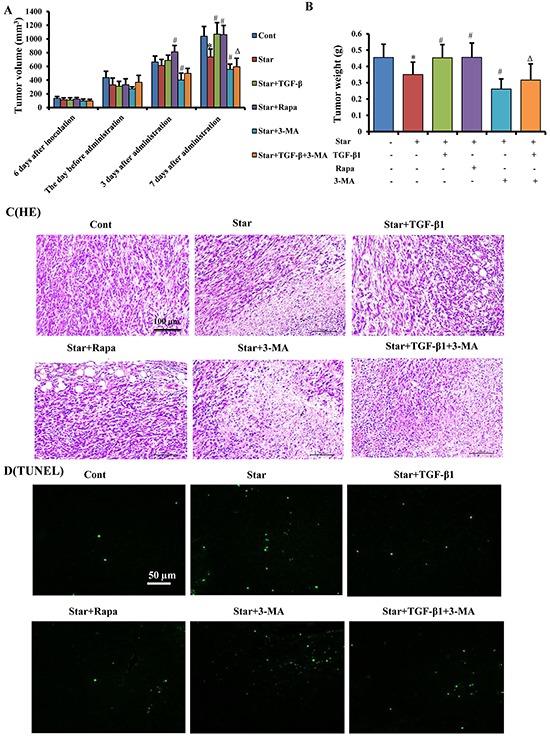
Transforming growth factor-β1 (TGF-β1) present in tumor microenvironment acts in a coordinated fashion to either suppress or promote tumor development. However, the molecular mechanisms underlying the effects of TGF-β1 on tumor microenvironment are not well understood. Our clinical data showed a positive association between TGF-β1 expression and cancer-associated fibroblasts (CAFs) in tumor microenvironment of breast cancer patients. Thus we employed starved NIH3T3 fibroblasts in vitro and 4T1 cells mixed with NIH3T3 fibroblasts xenograft model in vivo to simulate nutritional deprivation of tumor microenvironment to explore the effects of TGF-β1. We demonstrated that TGF-β1 protected NIH3T3 fibroblasts from Star-induced growth inhibition, mitochondrial damage and cell apoptosis. Interestingly, TGF-β1 induced the formation of CAFs phenotype in starvation (Star)-treated NIH3T3 fibroblasts and xenografted Balb/c mice, which promoted breast cancer tumor growth. In both models, autophagy agonist rapamycin increased TGF-β1-induced protective effects and formation of CAFs phenotypes, while autophagy inhibitor 3-methyladenine, Atg5 knockdown or TGF-β type I receptor kinase inhibitor LY-2157299 blocked TGF-β1 induced these effects. Taken together, our results indicated that TGF-β/Smad autophagy was involved in TGF-β1-induced protective effects and formation of CAFs phenotype in tumor microenvironment, which may be used as therapy targets in breast cancer.

Keywords: TGF-β1; autophagy; cancer-associated fibroblasts; mitochondria; tumor microenvironment.


Conflict of interest statement

CONFLICTS OF INTEREST

The authors declare no financial or commercial conflict of interest.

Figures

Figure 1
Figure 1. Expression of TGF-β and CAFs maker α-SMA were both increased in tumor tissues of breast cancer patients
TGF-β and α-SMA expression were analyzed by immunohistochemistry staining in normal breast tissue (n=10) or tumor tissues from patients with breast cancer (n=121).
Figure 2
Figure 2. TGF-β1 exerted protective effects and induced formation of CAFs phenotype in Star-treated NIH3T3 fibroblasts
A. Time-dependent growth inhibitory effects of Star in NIH3T3 cells. Cells were first incubated under serum-free condition for different time (24∼48 h), and then treated with different concentrations TGF-β1 (1.25ng/ml∼5ng/ml) in 10% fetal bovine serum for 24 h. The inhibitory ratio was determined by MTT assay. B. Cells were first incubated under serum-free condition for 24 h, and then treated with TGF-β1 (2.5ng/ml) in 10% fetal bovine serum for 24 h. MMP was evaluated with TMRM staining using confocal laser scanning microscopy. Cells were counter-stained with Hoechest 33258 for DNA. Arrows indicate cells with poor shape. C. Cells were first incubated under serum-free condition for 24 h, and then treated with TGF-β1 (2.5ng/ml) in 10% fetal bovine serum for 24 h. Cells were subjected to western blotting analysis with antibodies directed against CAFs markers α-SMA and FAP-α. β-actin was used as an equal loading control. D. Cells were first incubated under serum-free condition for 24 h, and then treated with TGF-β1 (2.5ng/ml) in 10% fetal bovine serum for 24 h. Fluorescence microscopy of NIH3T3 fibroblasts dually stained with α-SMA (probed with primary anti-α-SMA antibody, and a secondary antibody using FITC 488, Santa Cruz, USA) and FAP-α (probed with primary anti-FAP-α antibody and a secondary antibody using DyLight 649, Abbkine, USA). Cells were counter-stained with Hoechest 33258 for DNA. Cont, control; Star: starvation, free-serum for 24 h; TGF-β1, 2.5 ng/ml; Rapa, 500 nM; 3-MA, 2 Mm. Data were expressed as the means ± S.E.M. (n=3). **P < 0.01 vs. Cont, #P < 0.05 and ##P < 0.01 vs. Star-treated cells.
Figure 3
Figure 3. TGF-β1 enhanced autophagy in Star-treated NIH3T3 fibroblasts
Cells were first incubated under serum-free condition for 24 h, and then treated with TGF-β1 (2.5ng/ml) in 10% fetal bovine serum and the presence or absence of Rapa (500 nM) or 3-MA (2 mM) for 24 h. A. Formation of autophagic vacuoles was evaluated with MDC staining using immunofluorescence. B. Autophagy related genes of MAPLC3β and BECN1 were analyzed by Q-PCR. C. Protein expression levels of the mitophagy (BNIP3) and autophagy markers (Beclin-1 and LC3-II/I conversion) were evaluated by western blotting. Cells were first incubated under serum-free condition for 24 h, and then treated with TGF-β1 (2.5ng/ml) in 10% fetal bovine serum and the presence or absence of Rapa (500 nM) or 3-MA (2 mM) for 24 h. D. Confocal fluorescence microscopy of NIH3T3 fibroblasts dually stained with LC3β (probed with primary anti-LC3β antibody, and a secondary antibody using Alexa Fluor, Cell Signaling Technology) and Mito Red. Cells were counter-stained with Hoechest 33258 for DNA. Arrows indicate cells with poor shape. E. Transmission electron microscopy of NIH3T3 fibroblasts. Autolysosomes were indicated with red arrows; swelling mitochondria were indicated with yellow arrows. Cont, control; Star: starvation, free-serum for 24 h; TGF-β1, 2.5 ng/ml; Rapa, 500 nM; 3-MA, 2 mM. Data are expressed as the means ± S.E.M. (n=3). **P < 0.01 vs. Cont, #P < 0.05 and ##P < 0.01 vs. Star-treated cells, and ΔΔP < 0.01 vs. Star/TGF-β1 treated group.
Figure 4
Figure 4. Autophagy was involved in TGF-β1-induced protection and CAFs phenotype formation in Star-treated NIH3T3 fibroblasts
Cells were first incubated under serum-free condition for 24 h, and then treated with TGF-β1 (2.5ng/ml) in 10% fetal bovine serum and the presence or absence of Rapa (500 nM) or 3-MA (2 mM) for 24 h. A. Effect of TGF-β1 (2.5 ng/ml) and autophagy modulators (Rapa, 500 nM; 3-MA, 2 mM) on Star-induced growth inhibition. B. Evaluation of MMP with TMRM staining using flow cytometry. C. Apoptosis-related protein expression levels of caspase-3, caspase-9, Bax, and Bcl-2 in NIH3T3 fibroblasts were analyzed by western blotting. D. Confocal fluorescence microscopy of NIH3T3 fibroblasts dually stained with α-SMA (probed with primary anti-α-SMA antibody, and a secondary antibody using FITC 488, Santa Cruz, USA) and LC3β (probed with primary anti-LC3β antibody and a secondary antibody using DyLight 649, Abbkine, USA). Cells were counter-stained with Hoechest 33258 for DNA. Arrows indicate cells with poor shape. Cont, control; Star: starvation, free-serum for 24 h; TGF-β1, 2.5 ng/ml; Rapa, 500 nM; 3-MA, 2 mM. Data are expressed as the means ± S.E.M. (n=3). **P < 0.01 vs. Cont, #P < 0.05 and ##P < 0.01 vs. Star-treated cells, and ΔΔP < 0.01 vs. Star/ TGF-β1 treated group.
Figure 5
Figure 5. Atg5 knockdown blocked TGF-β1-induced protection and formation of CAFs phenotype in Star-treated NIH3T3 fibroblasts
ATG5 knockdown was performed in NIH3T3 fibroblasts using RNAi procedure, ATG5 siRNA transfected cells were first incubated under serum-free condition for 24 h, and then treated with 10% fetal bovine serum with TGF-β1 (2.5 ng/ml). A. ATG5 knockdown was performed in NIH3T3 fibroblasts using RNAi procedure. B. Effect of ATG5 knockdown on protein expression levels of ATG5, LC3-II/I, and Beclin 1 determined by western blotting. C. Cells were stained with fluorescein isothiocyanate (FITC)-conjugated annexin V (5 μg/ml) and PI (10 μg/ml). Cell apoptosis or necrosis was analyzed by flow cytometry. Positioning of quadrants on Annexin V/PI dot plots is performed, and living cells (Q3: Annexin V-/PI-), early apoptotic/primary apoptotic cells (Q4: Annexin V+/PI-), late apoptotic/secondary apoptotic cells (Q2: Annexin V+/PI+) and necrotic cells (Q1: Annexin V-/PI+) were distinguished. Total apoptotic proportion includes the percentage of cells with fluorescence Annexin V+/PI- and Annexin V+/PI+. D. Confocal fluorescence microscopy of NIH3T3 fibroblasts dually stained with α-SMA (probed with primary anti-α-SMA antibody, and a secondary antibody using FITC 488, Santa Cruz, USA) and FAP-α (probed with primary anti-FAP-α antibody and a secondary antibody using DyLight 649, Abbkine, USA). Cells were counter-stained with Hoechest 33258 for DNA. Cont, control; Star: starvation, serum-free for 24 h; TGF-β1, 2.5 ng/ml. Data are expressed as the means ± S.E.M. (n=3). **P < 0.01 vs. Cont, #P < 0.05 and ##P < 0.01 vs. Star-treated cells, and ΔΔP < 0.01 vs. Star/TGF-β1 treated group.
Figure 6
Figure 6. TGF-β/Smad autophagy signaling pathway was involved in TGF-β1-induced protection and formation of CAFs phenotype in Star-treated NIH3T3 fibroblasts
Cells were first incubated under free-serum condition for 24 h, followed by treatment in 10% fetal bovine serum with TGF-β1 (2.5ng/ml) in the presence or absence of LY-2157299 (1 μM) for 24 h. A. The expression levels of Smads proteins p-Smad2, Smad2, p-Smad3, Smad3 and autophagy-relative proteins Beclin 1 and LC3β-I/II in NIH3T3 fibroblasts were analyzed by Western blotting. B. The expression levels of CAFs phenotype α-SMA and FAP-α were analyzed by western blotting. C. Evaluation of MMP with TMRM staining using immunofluorescence analysis. Cells were counter-stained with Hoechest 33258 for DNA. Cont, control; Star: starvation, free-serum for 24 h; TGF-β1, 2.5 ng/ml; Rapa, 500 nM; 3-MA, 2 mM; LY-2157299, 1 μM. Data are expressed as the means ± S.E.M. (n=3). **P < 0.01 vs. Cont, #P < 0.05 and ##P < 0.01 vs. Star-treated cells, and ΔΔP < 0.01 vs. Star/TGF-β1 treated group.
Figure 7
Figure 7. TGF-β1-induced autophagy could also activate the formation of CAFs phenotype in tumor microenvironment of mixed xenograft tumor
Cells were first incubated under free-serum condition for 24 h, followed by treatment in 10% fetal bovine serum with TGF-β1 (2.5ng/ml). The treated NIH3T3 fibroblasts were mixed with 4T1 breast cancer cells, and then implanted subcutaneously (s.c.) into the right flank of female Balb/c mice. A, B. To evaluate if TGF-β1 induced CAFs features in tumor microenvironment, tumor tissues were analyzed by immunohistochemical staining with antibodies directed against α-SMA and FAP-α. C. The protein expression levels of the mitophagy (BNIP3) and autophagy markers [Beclin-1 and LC3II (lower band)] were evaluated by western blotting analysis in tumor tissues. β-actin was used as an equal loading control. D. The co-localization of α-SMA and LC3β-II in tumor tissues dually stained with α-SMA (probed with primary anti-α-SMA antibody, and a secondary antibody using FITC 488, Santa Cruz, USA) and LC3β (probed with primary anti-LC3β antibody and a secondary antibody using DyLight 649, Abbkine, USA). Cont, control; Star: starvation, free-serum for 24 h; TGF-β1, 2.5 ng/ml; Rapa, 1 mg/kg; 3-MA, 15 mg/kg. Results presented are the means ± S.E.M. (n=7). **P < 0.01 vs. Cont, #P < 0.05 and ##P < 0.01 vs. Star-treated cells, and ΔΔP < 0.01 vs. Star/TGF-β1 treated group.
Figure 8
Figure 8. TGF-β1-induced autophagy promoted tumor growth of mixed xenograft tumor in Balb/c mice
Cells were first incubated under free-serum condition for 24 h, followed by treatment in 10% fetal bovine serum with TGF-β1 (2.5ng/ml). The treated NIH3T3 fibroblasts were mixed with 4T1 breast cancer cells, and then implanted subcutaneously (s.c.) into the right flank of female Balb/c mice. A. Tumor volume was monitored every day by two-dimensional measurements of individual tumors for each mouse. Tumor volume (cm3) was calculated according to the formula: (π/6) × tumor length × tumor width2. B. The tumors were taken 22 days after implantation. The tumor weights were recorded. C. Tumor sections were stained with H&E for histological examination to determine tumorous morphology and architectural changes. D. Apoptosis of tumor tissues were measured by TUNEL staining. Cont, control; Star: starvation, free-serum for 24 h; TGF-β1, 2.5 ng/ml; Rapa, 1 mg/kg; 3-MA, 15 mg/kg. Results presented are the means ± S.E.M. (n=7). Results presented are the means ± S.E.M. (n=7).**P < 0.01 vs. Cont, #P < 0.05 and ##P < 0.01 vs. Star-treated cells, and ΔΔP < 0.01 vs. Star/TGF-β1 treated group.

Similar articles

Cited by

References

    1. Castells M, Thibault B, Delord JP, Couderc B. Implication of tumor microenvironment in chemoresistance: tumor-associated stromal cells protect tumor cells from cell death. International journal of molecular sciences. 2012;13:9545–9571. - PMC - PubMed
    1. Hanahan D, Weinberg RA. Hallmarks of cancer: the next generation. Cell. 2011;144:646–674. - PubMed
    1. Franco OE, Shaw AK, Strand DW, Hayward SW. Cancer associated fibroblasts in cancer pathogenesis. Seminars in cell & developmental biology. 2010;21:33–39. - PMC - PubMed
    1. Li T, Yang Y, Hua X, Wang G, Liu W, Jia C, Tai Y, Zhang Q, Chen G. Hepatocellular carcinoma-associated fibroblasts trigger NK cell dysfunction via PGE2 and IDO. Cancer letters. 2012;318:154–161. - PubMed
    1. Chen H, Yang WW, Wen QT, Xu L, Chen M. TGF-beta induces fibroblast activation protein expression; fibroblast activation protein expression increases the proliferation, adhesion, and migration of HO-8910PM [corrected] Experimental and molecular pathology. 2009;87:189–194. - PubMed

Publication types

MeSH terms