. 2015 Dec 30;11(12):e1005748.
doi: 10.1371/journal.pgen.1005748. eCollection 2015 Dec.

Genome-Wide Transcriptional Regulation Mediated by Biochemically Distinct SWI/SNF Complexes

Affiliations

Genome-Wide Transcriptional Regulation Mediated by Biochemically Distinct SWI/SNF Complexes

Jesse R Raab et al. PLoS Genet. .

Abstract

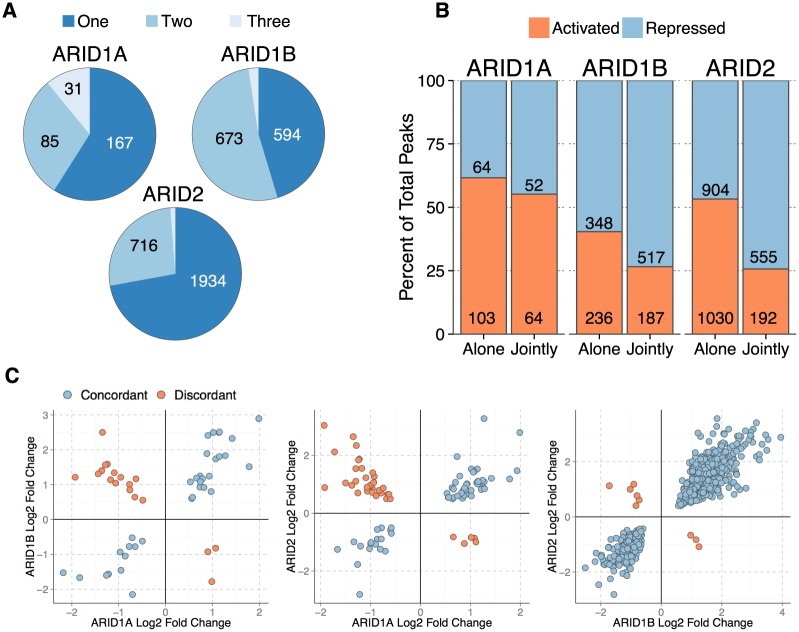
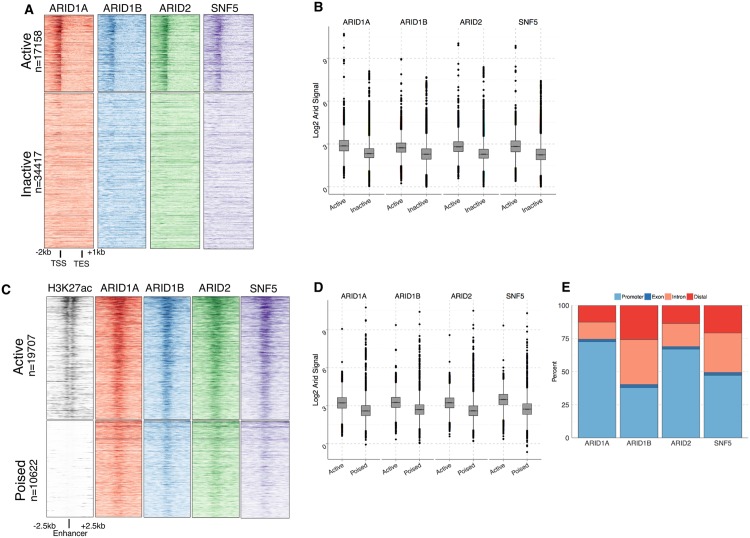
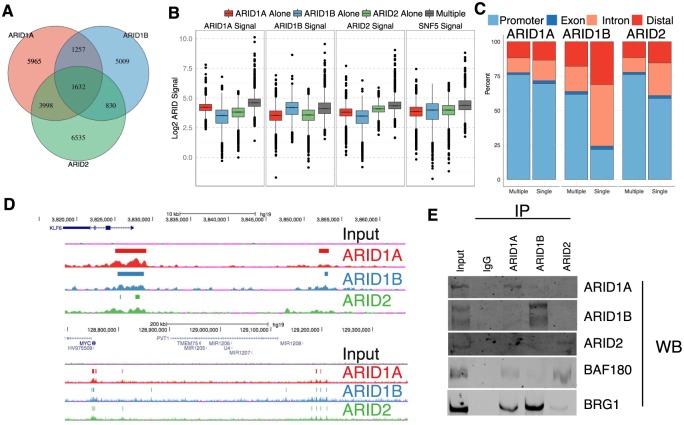
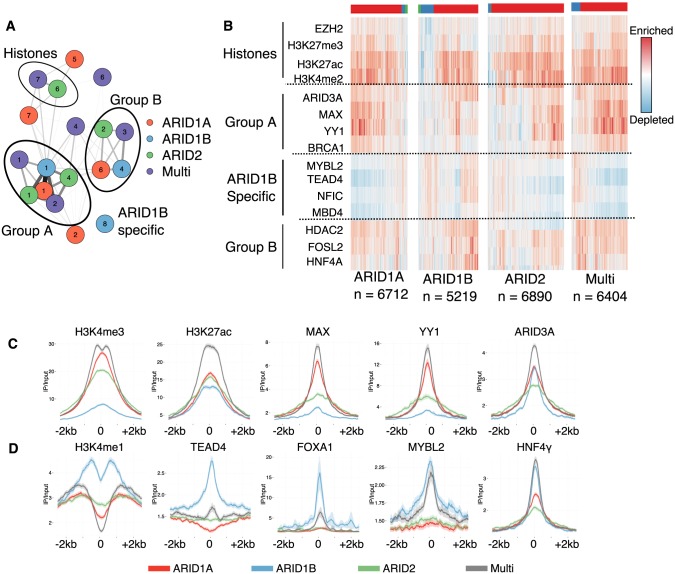
Multiple positions within the SWI/SNF chromatin remodeling complex can be filled by mutually exclusive subunits. Inclusion or exclusion of these proteins defines many unique forms of SWI/SNF and has profound functional consequences. Often this complex is studied as a single entity within a particular cell type and we understand little about the functional relationship between these biochemically distinct forms of the remodeling complex. Here we examine the functional relationships among three complex-specific ARID (AT-Rich Interacting Domain) subunits using genome-wide chromatin immunoprecipitation, transcriptome analysis, and transcription factor binding maps. We find widespread overlap in transcriptional regulation and the genomic binding of distinct SWI/SNF complexes. ARID1B and ARID2 participate in wide-spread cooperation to repress hundreds of genes. Additionally, we find numerous examples of competition between ARID1A and another ARID, and validate that gene expression changes following loss of one ARID are dependent on the function of an alternative ARID. These distinct regulatory modalities are correlated with differential occupancy by transcription factors. Together, these data suggest that distinct SWI/SNF complexes dictate gene-specific transcription through functional interactions between the different forms of the SWI/SNF complex and associated co-factors. Most genes regulated by SWI/SNF are controlled by multiple biochemically distinct forms of the complex, and the overall expression of a gene is the product of the interaction between these different SWI/SNF complexes. The three mutually exclusive ARID family members are among the most frequently mutated chromatin regulators in cancer, and understanding the functional interactions and their role in transcriptional regulation provides an important foundation to understand their role in cancer.


Conflict of interest statement

The authors have declared that no competing interests exist.

Figures

Fig 1
Fig 1. Analysis of ARID mediated transcriptional regulation.
A. Number of genes altered by loss of an ARID that are affected by one, two, or three ARIDs. B. Direction (Activated or Repressed) of gene expression changes in alone compared to jointly regulated genes (ARID1A—Not Significant, ARID1B—p-value = 1.9 × 10⁻⁷, ARID2—p-value = 1.64 × 10−37, Chi-squared test). C. Pair-wise comparison of Log2 Fold Changes following knockdown of each ARID shows the numbers of genes regulated in the same direction (concordant—blue) compared to regulated in an opposing manner (discordant—pink). Positive values for log2 fold change indicate repressive action, while negative log2 fold change values indicate activation. ARID1A—ARID1B r2 = 0.185, p-value = 0.001; ARID1A-ARID2 r2 = 0.03, p-value = 0.054; ARID1B-ARID2 r2 = 0.85, p-value <2.2 × 10⁻¹⁶)
Fig 2
Fig 2. Identification of ARID bound regions A.
ChIP-seq signal aligned to all transcripts (Gencode annotations V16). Rows in top panel correspond to 17158 expressed transcripts from RNA-seq data, ordered by relative expression level. Bottom panel is all remaining non-expressed/lowly expressed transcripts unordered. B. Signal of each ARID at the different classes of transcription start sites (quantification of panel A). C. ChIP-seq signal aligned to all enhancers defined using ENCODE data for p300 and H3K4me1. Enhancers are greater than 2kb from the nearest TSS and active enhancers (top panels—19707 enhancers) are distinguished from poised enhancers (bottom panel—10622 enhancers) by presence of H3K27ac. D. Signal of each ARID at active compared to poised enhancers (quantification of panel C). E. Location of ARID bound regions relative to genomic features.
Fig 3
Fig 3. Overlap of ARID binding.
A. Venn-diagram depicting overlap among peaks for each of three ARID proteins. B. Comparison of signal at ARID1A alone, ARID1B alone, ARID2 alone, and Multiple bound ARID regions. C. Genomic distribution for ARID peaks, categorized by whether the peak was bound by a single ARID or multiple ARID subunits. D. Example of ARID1A, ARID1B, and ARID2 binding at the KLF6 (top) and MYC (bottom) loci. Colored bars denote called peaks for each ARID. All scales are equal, and are normalized to reads per 30bp per 10 million mapped reads. E. Co-immunoprecipitations with each ARID subunit followed by western blotting for each ARID subunit as well as BAF180 (PBAF subunit), and BRG1.
Fig 4
Fig 4. Identifcation of transcription factor clusters at ARID bound regions.
A. Network diagram of similarity between cluster assignments for each ARID. Edge weight signifies the number of transcription factors or histone modifiers common to both nodes, and the color of the node signifies which ARID peak set the cluster refers to (see Materials and methods for details). Placement of nodes within the network is done using the qgraph R package and the ‘spring’ layout. B. Enrichment of transcription factors at different peak sets. Colored bar along top indicate KMeans cluster assignment of the peaks (k = 3). C. Metagene plots centered at the ARID bound peak center +/- 2.5kb for each of the ChIP-seq signals more common at ARID1A bound regions, and D. ARID1B bound regions. For all panels line represents the average signal centered on a particular class of ARID peaks, with the shading depicting the 95% confidence interval.
Fig 5
Fig 5. Multiple knockdown of ARID genes.
A. The EPHA2 locus is an example of a gene regulated by multiple ARIDs. Colored bars depict locations of called peaks. All ChIP-seq signal intensities are normalized to reads per 30bp per 10 million mapped reads and are shown on the same relative scale. B. Single and combinatorial knockdown of ARID1A, ARID1B, and ARID2 and followed by qPCR expression measurements of the ARID genes. C. Expression changes in a panel of genes expected to be up-regulated by the loss of either ARID1B or ARID2, and down-regulated following loss of ARID1A. Error bars represent 95% confidence intervals and the experiment was repeated a minimum of 4 times.
Fig 6
Fig 6. Knockdown of ARID1A leads to decrease in ARID1A binding and H3K27ac.
A. Six loci were selected based on the presence of both ARID1A and ARID2 and the opposing gene expression changes associated with ARID1A and ARID2 depletion. Primer locations are noted by a black bar. B. Western blot on ARID1A and ARID2 in HepG2 cells stably transduced with a non-silencing or two ARID1A shRNAs (TRCN0000059091: shRNA-1, TRCN0000059090: shRNA-2). C. ChIP-qpcr analysis in cell lines from B. Error bars represent SEM of 3 independent experiments. Asterisk denotes p-value <0.05 by two-tailed T test.
Fig 7
Fig 7. Transcription factor binding at different classes of direct ARID targets.
A. Percent of differentially expressed (DE) genes associated with an ARID. Asterisk denotes statistical significance p <0.01 by hypergeometric test. B. Median signal measured at the mid-region of the peak (3kb) comparing ARID1A and ARID2 peaks associated with competitive or cooperative interactions. There were 63, 37, 58, 23 peaks associated with ARID1A cooperativity, ARID1A competition, ARID2 cooperativity, ARID2 competition respectively. C. Median signal over mid-region of peak (3kb) comparing peaks associated with activated or repressed peaks. There were 88, 287, 119, 489 peaks associated with ARID1B activation, ARID1B repression, ARID2 activation, and ARID2 repression respectively. In both B and C differences for all transcription factors and histones were compared by Wilcoxon Rank Sum Test for each set of ARID peaks comparing activated and repressed or competitive and cooperative. We adjusted p-values using Benjamini-Hochberg correction for multiple testing, asterisk indicates p-value <0.05. D. Model for combinatorial control of transcription by distinct ARID complexes.

References

    1. Clapier CR, Cairns BR. The Biology of Chromatin Remodeling Complexes. Annu Rev Biochem. 2009. June;78(1):273–304. Available from: 10.1146/annurev.biochem.77.062706.153223 10.1146/annurev.biochem.77.062706.153223 - DOI - DOI - PubMed
    1. Wang W, Xue Y, Zhou S, Kuo A, Cairns BR, Crabtree GR. Diversity and specialization of mammalian SWI/SNF complexes. Genes & Development. 1996. September;10(17):2117–2130. Available from: 10.1101/gad.10.17.2117 10.1101/gad.10.17.2117 - DOI - DOI - PubMed
    1. Nagl NG, Wang X, Wilsker D, Van-Scoy M, Pacchione S, Yaciuk P, et al. Two related ARID family proteins are alternative subunits of human SWI/SNF complexes. Biochem J. 2004. October;383(2):319 Available from: 10.1042/BJ20040524 10.1042/BJ20040524 - DOI - DOI - PMC - PubMed
    1. Ho L, Jothi R, Ronan JL, Cui K, Zhao K, Crabtree GR. An embryonic stem cell chromatin remodeling complex esBAF is an essential component of the core pluripotency transcriptional network. Proceedings of the National Academy of Sciences. 2009. March;106(13):5187–5191. Available from: 10.1073/pnas.0812888106 10.1073/pnas.0812889106 - DOI - DOI - PMC - PubMed
    1. Lessard J, Wu JI, Ranish JA, Wan M, Winslow MM, Staahl BT, et al. An Essential Switch in Subunit Composition of a Chromatin Remodeling Complex during Neural Development. Neuron. 2007. July;55(2):201–215. Available from: 10.1016/j.neuron.2007.06.019 10.1016/j.neuron.2007.06.019 - DOI - DOI - PMC - PubMed

Publication types