Case Reports
. 2015 Dec 30;10(12):e0146035.
doi: 10.1371/journal.pone.0146035. eCollection 2015.

A Single Amino Acid Deletion (ΔF1502) in the S6 Segment of CaV2.1 Domain III Associated with Congenital Ataxia Increases Channel Activity and Promotes Ca2+ Influx

Affiliations
Case Reports

A Single Amino Acid Deletion (ΔF1502) in the S6 Segment of CaV2.1 Domain III Associated with Congenital Ataxia Increases Channel Activity and Promotes Ca2+ Influx

Maria Isabel Bahamonde et al. PLoS One. .

Abstract

Mutations in the CACNA1A gene, encoding the pore-forming CaV2.1 (P/Q-type) channel α1A subunit, result in heterogeneous human neurological disorders, including familial and sporadic hemiplegic migraine along with episodic and progressive forms of ataxia. Hemiplegic Migraine (HM) mutations induce gain-of-channel function, mainly by shifting channel activation to lower voltages, whereas ataxia mutations mostly produce loss-of-channel function. However, some HM-linked gain-of-function mutations are also associated to congenital ataxia and/or cerebellar atrophy, including the deletion of a highly conserved phenylalanine located at the S6 pore region of α1A domain III (ΔF1502). Functional studies of ΔF1502 CaV2.1 channels, expressed in Xenopus oocytes, using the non-physiological Ba2+ as the charge carrier have only revealed discrete alterations in channel function of unclear pathophysiological relevance. Here, we report a second case of congenital ataxia linked to the ΔF1502 α1A mutation, detected by whole-exome sequencing, and analyze its functional consequences on CaV2.1 human channels heterologously expressed in mammalian tsA-201 HEK cells, using the physiological permeant ion Ca2+. ΔF1502 strongly decreases the voltage threshold for channel activation (by ~ 21 mV), allowing significantly higher Ca2+ current densities in a range of depolarized voltages with physiological relevance in neurons, even though maximal Ca2+ current density through ΔF1502 CaV2.1 channels is 60% lower than through wild-type channels. ΔF1502 accelerates activation kinetics and slows deactivation kinetics of CaV2.1 within a wide range of voltage depolarization. ΔF1502 also slowed CaV2.1 inactivation kinetic and shifted the inactivation curve to hyperpolarized potentials (by ~ 28 mV). ΔF1502 effects on CaV2.1 activation and deactivation properties seem to be of high physiological relevance. Thus, ΔF1502 strongly promotes Ca2+ influx in response to either single or trains of action potential-like waveforms of different durations. Our observations support a causative role of gain-of-function CaV2.1 mutations in congenital ataxia, a neurodevelopmental disorder at the severe-most end of CACNA1A-associated phenotypic spectrum.


Conflict of interest statement

Competing Interests: The authors have declared that no competing interests exist.

Figures

Fig 1
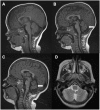
Fig 1. Brain MRI of the proband at the age of 14 months (A), 28 months (B), and 4 and a half years (C,D).
After the initial normal findings (A), note the progressive cerebellar atrophy mainly involving the complete vermis (indicated by the arrows in B, C). The hemispheres, displaying prominence of the cerebellar folia, were eventually affected (D).
Fig 2
Fig 2. De novo heterozygous CACNA1A deletion in congenital ataxia with cerebellar atrophy.
(A) Pedigree of the affected individual carrying the de novo heterozygous ΔF1502 mutation. White symbols denote healthy individuals and grey, congenital ataxia. (B) Electropherograms showing the deleted nucleotides (bracket) (NM_001127221.1-transcript variant 3:c.4503-4505delCTT) leading to a F1052 deletion (NP_001120693.1). Note the double wild-type (WT) and mutant (ΔF1502) sequence in the patient’s electropherogram (heterozygous mutation carrier).
Fig 3
Fig 3. Evolutionary conservation of the F1502 residue and predicted location at the channel pore.
(A) Sequence alignment of individual S6 segments at domains I to IV (DI-DIV) of human CaV2.x channel α1 subunits (P/Q type CaV2.1; N-type CaV2.2; R-type CaV2.3), human CaV1.x (L-type) channel α1 subunits, and the bacterial sodium channel NaVAb (top); sequence alignment of S6-DIII of CaV2.1 channels from different species (as indicated). The three Phenylalanine’s group (in red) is conserved in the human CaV2.1 channel α1A subunit, where F1502 is located at the third position. This particular amino acid residue is only conserved in S6-DIII of CaV2 type channels. The phenylalanine’s group is totally conserved in S6-DIII of CaV2.1 channels from different species. The alignments were performed with T-Coffee (T-Coffee). (B,C,D) Location of the F1502 homologous methionine residue (M209), using the NaVAb structure as a model (PDB 4EKW). A methionine residue is also present at the F1502 position in L-type channels. The side view (B) show a red highlighted M209 residue in NaVAb, which lines the inner pore vestibule of the channel. A view from the cytoplasm looking up through the channel pore show the arrangement of M209 residue in the four NaVAb subunits (C), and a zoom of the pore region from the same view is shown in (D). Images were generated using UCSF Chimera package. Chimera is developed by the Resource for Biocomputing, Visualization, and Informatics at the University of California, San Francisco (supported by NIGMS P41-GM103311) [79].
Fig 4
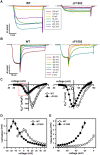
Fig 4. ΔF1502 induces a gain-of-function in the heterologously expressed CaV2.1 channel by affecting its activation and deactivation properties.
(A) Representative current traces elicited by 20 ms depolarizing pulses from -80 mV to the indicated voltages (inset), illustrating the difference in voltage-dependence and activation kinetics between wild-type (WT) (left) and ΔF1502 (right) CaV2.1 channels. Dotted lines indicate the zero current level. (B) Representative current traces showing distinct deactivation kinetics of WT (left) and ΔF1502 (right) CaV2.1 channels, obtained by hyperpolarizing the cells during 30 ms at the indicated voltages (inset) following a 20 ms depolarizing pulse to +20 mV (for WT channels) or -5 mV (for ΔF1502 channels). The zero current level is indicated by dotted lines. (C) Average current density-voltage relationships (left) and normalized I-V curves (right) for WT (open circles, n = 27) and ΔF1502 (filled circles, n = 19) CaV2.1 channels expressed in tsA-201 HEK cells. Red box indicates the voltage range at which peak Ca2+ current densities through ΔF1502 channels exceed those produced by WT channels. Average V1/2 act, kact and Vrev values were (in mV): WT (open circles, n = 27) 3.8 ± 0.6, 3.5 ± 0.15 and 62.4 ± 1.4; ΔF1502 (filled circles, n = 19) -17.1 ± 0.9, 4.4 ± 0.19 and 51.6 ± 2.2, respectively. Average activation (D) and deactivation (E) kinetics of WT (open circles) and ΔF1502 CaV2.1 Ca2+ currents (filled circles) at the indicated voltages.
Fig 5
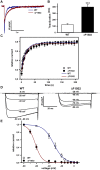
Fig 5. ΔF1502 affects CaV2.1 channel inactivation properties.
(A) Representative current traces illustrating the slower inactivation kinetics for ΔF1502 CaV2.1 channels (red trace) when compared to WT channels (blue trace), in response to a 3 s depolarizing pulse to +20 mV. (B) Average τinactivation values of Ca2+ currents through WT (open bar, n = 10) and ΔF1502 (filled bar, n = 8) CaV2.1 channels, elicited as indicated in panel (A). (C) Similar time course of Ca2+ current recovery from inactivation for WT and ΔF1502 CaV2.1 channels. Average τ of current recovery from inactivation obtained after fitting the data to a single exponential (solid color lines), were (in s): WT (open circles, n = 7) 15.5 ± 1.1; ΔF1502 (filled circles, n = 5) 16.9 ± 2.1 (P = 0.5, Student’s t test). (D, E) Steady-state inactivation of WT and ΔF1502 CaV2.1 channels. Amplitudes of currents elicited by test pulses to +20 mV (for WT channels) or -5 mV (for ΔF1502 channels) were normalized to the current obtained after a 30 s prepulse to -80 mV and fitted by a single Boltzmann function (solid color traces) (see Materials and Methods, Eq 2). Average V1/2 inact and kinact values were (in mV): WT (open circles, n = 19) -32.2 ± 2.1 and -5.3 ± 0.3; ΔF1502 (filled circles, n = 12) -60.7 ± 1 and -5.2 ± 0.8, respectively. No significant difference was found for kinact values (P = 0.89, Mann-Whitney test).
Fig 6
Fig 6. ΔF1502 effects on Ca2+ influx evoked by single action potential-like waveforms (APWs).
(A) Average Ca2+ current traces evoked by APWs of different durations (fast (left panels), medium (central panels) and slow (right panels) (see Materials and Methods for details) obtained from tsA-201 HEK cells expressing WT (blue traces) or ΔF1502 (red traces) CaV2.1 channels. Dotted lines stand for the zero current level. (B) Average data for peak Ca2+ (ICa 2+) current density (top panel), normalized Ca2+ influx (QCa 2+) (second panel), time to peak (third panel), and time for Ca2+ entry (bottom panel) in response to APWs of different durations obtained from cells expressing WT (blue bars, n = 12–14) or ΔF1502 (red bars, n = 8) CaV2.1 channels (*P < 0.05, **P < 0.001 and ***P < 0.0001 when compared to WT).
Fig 7
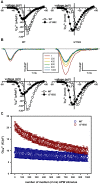
Fig 7. ΔF1502 effects on Ca2+ influx evoked by a 50 Hz train of 1 ms action potential-like waveforms (APWs).
(A) Average current density-voltage relationships (left) and normalized I-V curves (right) for WT (open circles, n = 9) and ΔF1502 (filled circles, n = 7) CaV2.1 channels expressed in tsA-201 HEK cells, before stimulation with a 50 Hz train of 1 ms APWs. In this series of experiments, maximal Ca2+ current density through CaV2.1 channels is still significantly reduced by ΔF1502 (left panel: from -100.92 ± 12.5 pA/pF (for WT, n = 9) to -47.18 ± 6.9 pA/pF (for ΔF1502, n = 7), P < 0.01, Student’s t test) and the significant left-shift induced by ΔF1502 on the CaV2.1 voltage-dependent activation is also present (right panel: WT V1/2 act = 2.27 ± 1.3 mV (n = 9) versus ΔF1502 V1/2 act = -17.73 ± 0.4 mV (n = 7), P < 0.0001, Student’s t test). (B) Representative Ca2+ current traces evoked by every 200th pulse of a 50 Hz train of fast (1 ms) APWs (see Materials and Methods for details) obtained from two tsA-201 HEK cells expressing either WT (left) or ΔF1502 (right) CaV2.1 channels. Dotted lines stand for the zero current level. The corresponding current density-voltage relationships (left) and normalized I-V curves (right), obtained from these two cells before stimulation with a 50 Hz train of fast APWs, are shown at the bottom (maximal Ca2+ current density through WT and ΔF1502 CaV2.1 channels are -91.7 pA/pF and -56.7 pA/pF, respectively; V1/2 act values for WT and ΔF1502 CaV2.1 channels are -0.5 mV and -18.97 mV, respectively). (C) Average data for Ca2+ influx normalized by cell size (QCa 2+) in response to every 5th pulse of a 50 Hz train of fast (1 ms) APWs, obtained from cells expressing WT (blue symbols, n = 9) or ΔF1502 (red symbols, n = 7) CaV2.1 channels.
Fig 8
Fig 8. ΔF1502 effects on Ca2+ influx evoked by a 42 Hz train of 2 ms action potential-like waveforms (APWs).
(A) Average current density-voltage relationships (left) and normalized I-V curves (right) for WT (open circles, n = 10) and ΔF1502 (filled circles, n = 11) CaV2.1 channels expressed in tsA-201 HEK cells, before stimulation with a 42 Hz train of 2 ms APWs. In this series of experiments, maximal Ca2+ current density through CaV2.1 channels is still significantly reduced by ΔF1502 (left panel: from -94.26 ± 18.9 pA/pF (for WT, n = 10) to -47.76 ± 5.7 pA/pF (for ΔF1502, n = 11), P < 0.05, Student’s t test) and the significant left-shift induced by ΔF1502 on the CaV2.1 voltage-dependent activation is also noticed (right panel: WT V1/2 act = 2.32 ± 1.18 mV (n = 10) versus ΔF1502 V1/2 act = -17.74 ± 0.35 mV (n = 11), P < 0.0001, Student’s t test). (B) Representative Ca2+ current traces evoked by every 200th pulse of a 42 Hz train of medium (2 ms) APWs (see Materials and Methods for details) obtained from two tsA-201 HEK cells expressing either WT (left) or ΔF1502 (right) CaV2.1 channels. Dotted lines stand for the zero current level. The corresponding current density-voltage relationships (left) and normalized I-V curves (right), obtained from these two cells before stimulation with a 42 Hz train of 2 ms APWs, are shown at the bottom (maximal Ca2+ current density through WT and ΔF1502 CaV2.1 channels are -115.28 pA/pF and -52.27 pA/pF, respectively; V1/2 act values for WT and ΔF1502 CaV2.1 channels are 2.52 mV and -17.23 mV, respectively). (C) Average data for Ca2+ influx normalized by cell size (QCa 2+) in response to every 5th pulse of a 42 Hz train of medium (2 ms) APWs, obtained from cells expressing WT (blue symbols, n = 10) or ΔF1502 (red symbols, n = 11) CaV2.1 channels.

References

    1. Catterall WA. Voltage-gated calcium channels. Cold Spring Harb Perspect Biol. 2011;3: a003947 10.1101/cshperspect.a003947 - DOI - PMC - PubMed
    1. Serra SA, Cuenca-León E, Llobet A, Rubio-Moscardo F, Plata C, Carreño O, et al. A mutation in the first intracellular loop of CACNA1A prevents P/Q channel modulation by SNARE proteins and lowers exocytosis. Proc Natl Acad Sci USA. 2010;107: 1672–1677. 10.1073/pnas.0908359107 - DOI - PMC - PubMed
    1. Westenbroek RE, Sakurai T, Elliott EM, Hell JW, Starr TV, Snutch TP, et al. Immunochemical identification and subcellular distribution of the α1A subunits of brain calcium channels. J Neurosci. 1995;15: 6403–6418. - PMC - PubMed
    1. Pineda JC, Waters RS, Foehring RC. Specificity in the interaction of HVA Ca2+ channel types with Ca2+-dependent AHPs and firing behavior in neocortical pyramidal neurons. J Neurophysiol. 1998;79: 2522–2534. - PubMed
    1. Womack MD, Chevez C, Khodakhah K. Calcium activated potassium channels are selectively coupled to P/Q type calcium channels in cerebellar Purkinje neurons. J Neurosci. 2004;24: 8818–8822. - PMC - PubMed

Publication types

Substances