. 2016 Feb 23;7(8):8756-70.
doi: 10.18632/oncotarget.6752.

Overexpression of miR-199a-5p decreases esophageal cancer cell proliferation through repression of mitogen-activated protein kinase kinase kinase-11 (MAP3K11)

Affiliations

Overexpression of miR-199a-5p decreases esophageal cancer cell proliferation through repression of mitogen-activated protein kinase kinase kinase-11 (MAP3K11)

Kimberly A Byrnes et al. Oncotarget. .

Abstract

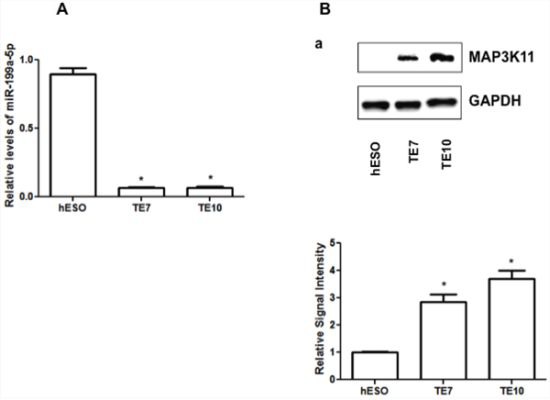
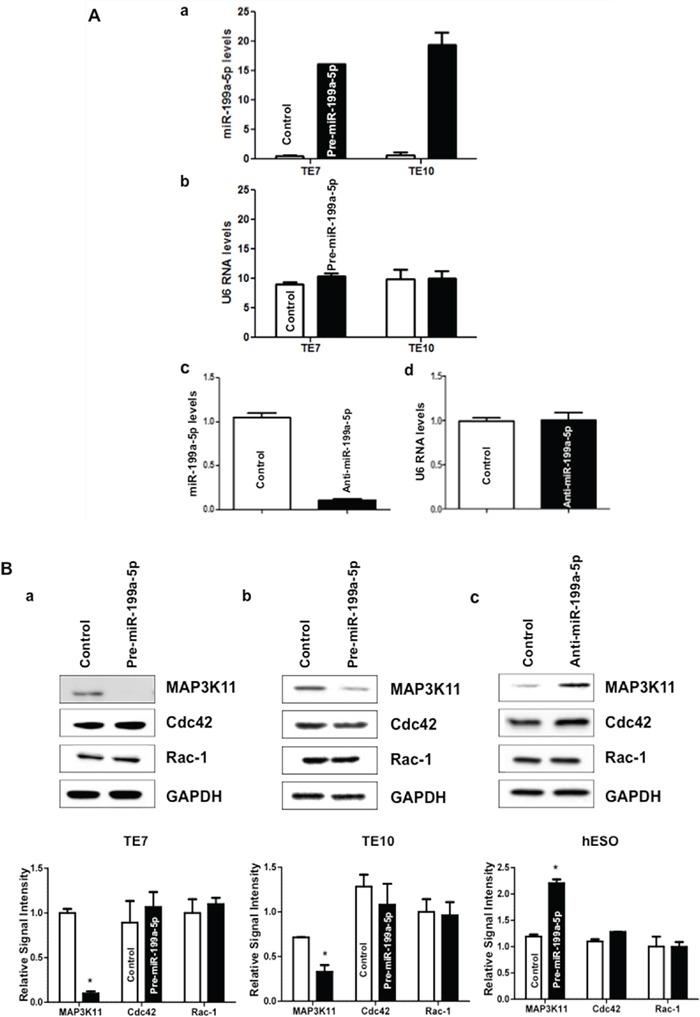
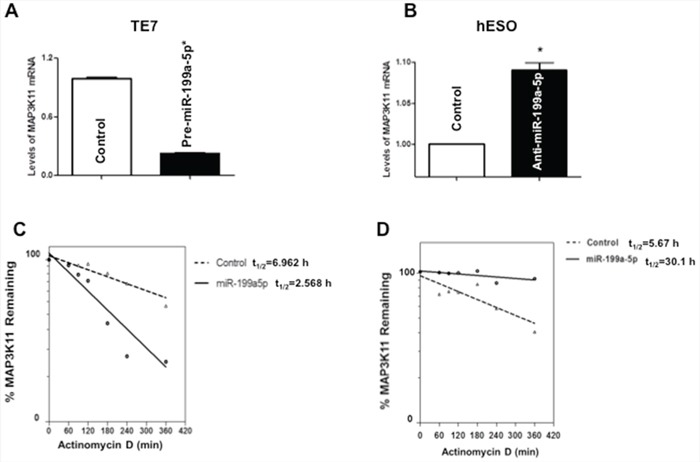
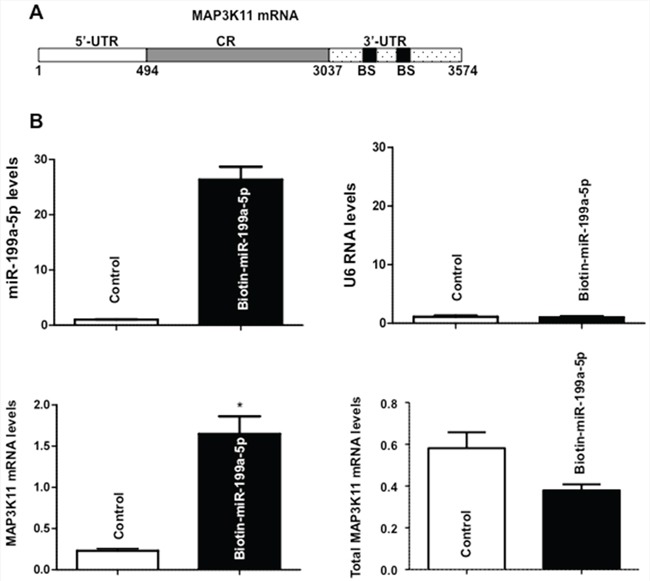
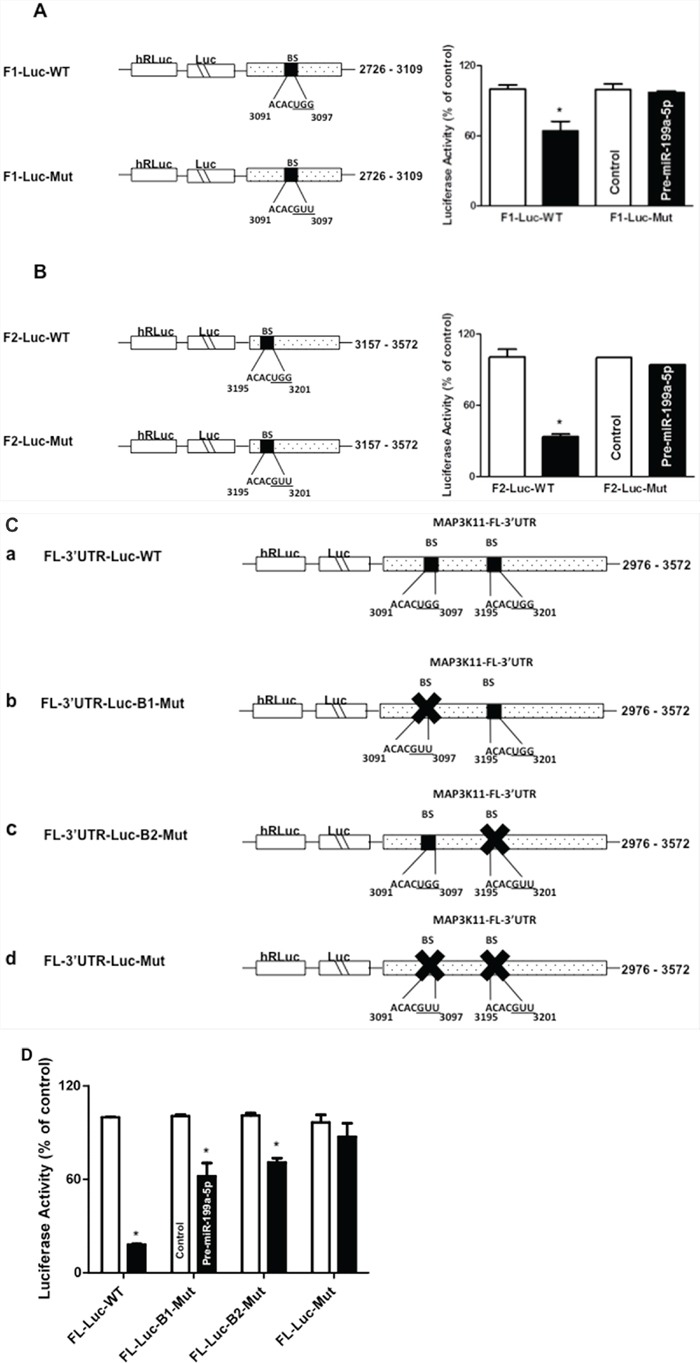
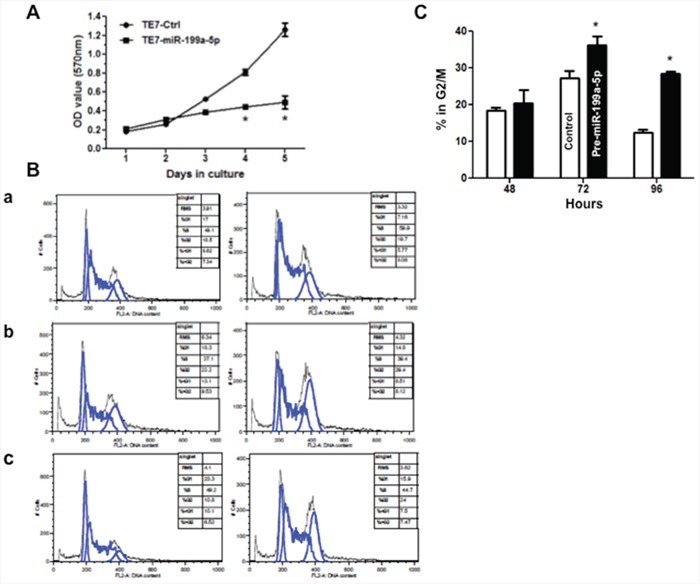
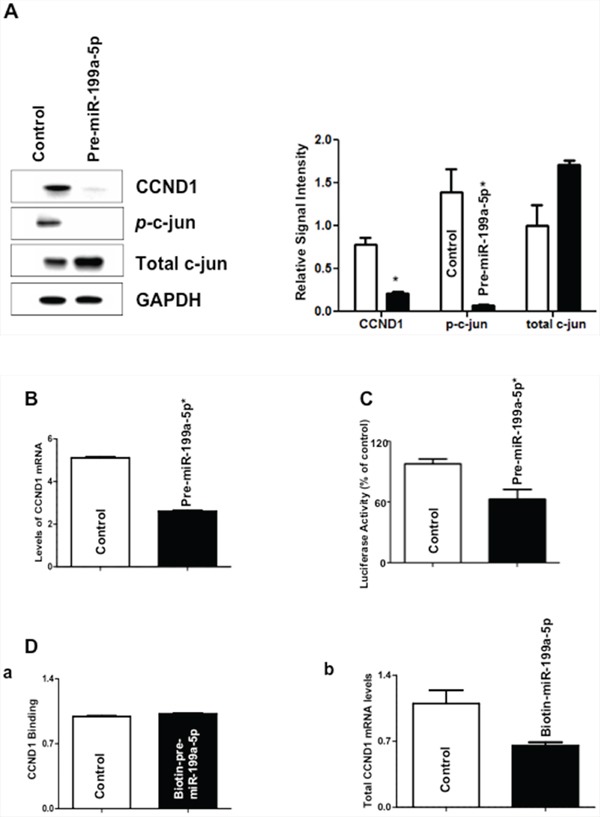
Studies examining the oncogenic or tumor suppressive functions of dysregulated microRNAs (miRs) in cancer cells may also identify novel miR targets, which can themselves serve as therapeutic targets. Using array analysis, we have previously determined that miR-199a-5p was the most downregulated miR in two esophageal cancer cell lines compared to esophageal epithelial cells. MiR-199a-5p is predicted to bind mitogen-activated protein kinase kinase kinase 11 (MAP3K11) mRNA with high affinity. In this study, we observed that MAP3K11 is markedly overexpressed in esophageal cancer cell lines. Forced expression of miR-199a-5p in these cells leads to a decrease in the mRNA and protein levels of MAP3K11, due to decreased MAP3K11 mRNA stability. A direct binding interaction between miR-199a-5p and MAP3K11 mRNA is demonstrated using biotin pull-down assays and heterologous luciferase reporter constructs and confirmed by mutational analysis. Finally, forced expression of miR-199a-5p decreases proliferation of esophageal cancer cells by inducing G2/M arrest. This effect is mediated, in part, by decreased transcription of cyclin D1, due to reduced MAP3K11-mediated phosphorylation of c-Jun. These findings suggest that miR-199a-5p acts as a tumor suppressor in esophageal cancer cells and that its downregulation contributes to enhanced cellular proliferation by targeting MAP3K11.

Keywords: MAP3K11; esophageal cancer; mRNA stability; miR-199a-5p; proliferation.


Conflict of interest statement

CONFLICTS OF INTEREST

The authors declare no conflict of interest.

Figures

Figure 1
Figure 1. Baseline miR-199a-5p and MAP3K11 protein expression levels in human esophageal cell lines
A. miR-199a-5p expression levels in hESO, TE7 and TE10 cells by q-PCR. B. Baseline protein expression levels of MAP3K11 in hESO, TE7 and TE10 cells. Representative experiment of three independent experiments. The adjacent bar diagram for relative protein signal intensity displays the mean signal intensity of three independent experiments. Signal intensity of target protein is determined and is normalized by signal intensity of GAPDH. Relative signal intensity is calculated compared to normal epithelial cells and is shown as bar diagram. Mean ± SD from three independent experiments. Asterisk, statistical significance based on two-tailed Student's t test. Signal intensity is determined using Bio-RAD image lab quantification software. Error bars represents ± S.D. and statistical significance based on a two-tailed Student's t test is indicated by *(p < 0.05).
Figure 2
Figure 2. miR-199a-5p negatively regulates MAP3K11 expression in human esophageal cell lines
A. Cells were transfected with control miR or (a) with 10 nM pre-miR-199a-5p (TE7 & TE10) or (c) with 25 nM anti-miR-199a-5p (hESO). Forty-eight hours post-transfection, levels of miR-199a-5p and U6 RNA (b, d) were measured by q-PCR. Values are mean ± SD from three independent sets of experiment in triplicate. B. In similar experiments, whole cell lysates were isolated and subjected to western blot analysis with indicated antibodies. Changes in MAP3K11, Cdc42, and Rac-1 protein expression after pre-miR-199a-5p transfection in (a) TE7 and (b) TE10 cells. (c) Changes in above mentioned protein expression after silencing miR-199a-5p in hESO cells. Representative immunoblots of three independent experiments in all the cell lines. The adjacent bar diagrams for relative protein signal intensity are the mean signal intensity of three separate immunoblots shown in a, b and c. Error bars represents ± S.D. and statistical significance based on a two-tailed Student's t test is indicated by *(p < 0.05).
Figure 3
Figure 3. Effect of miR-199a-5p modulation on MAP3K11 mRNA levels
A. Changes in levels of MAP3K11 mRNA in TE7 cells following transfection of pre-miR-199a-5p (10 nM) or control miR. B. Levels of MAP3K11 mRNA in hESO cells after transfection of anti-miR-199a-5p (25 nM) or control miR. In these experiments, 48 hours post-transfection, total RNA was extracted and levels of MAP3K11 were measured by q-PCR. Results represent the mean values of three biological and technical replicates. Error bars represents ± S.D. and statistical significance based on a two-tailed Student's t test is indicated by *(p < 0.05). C. Stability of MAP3K11 mRNA in TE7 cells following transfection of pre-miR-199a-5p (10 nM) or control miR. D. Stability of MAP3K11 mRNA in hESO cells after transfection of anti-miR-199a-5p (25 nM) or control miR. Total RNA was isolated at indicated time points after administration of Actinomycin D (4 μM) and the remaining levels of MAP3K11 mRNA were measured by q-PCR. Levels were normalized with GAPDH. The half-life was calculated from the first order equation t1/2 = ln2/k. Each point is the mean ± S.D. of three separate experiments.
Figure 4
Figure 4. Association of miR-199a-5p with MAP3K11 mRNA
A. Schematic representation of MAP3K11 mRNA. (BS) indicates predicted binding sites for miR-199a-5p. B. Levels of miR-199a-5p (Top panel, left) and U6 RNA (Top panel, right) 48 hours following transfection biotinylated-miR-199a-5p (50 nM) as measured by q-PCR analysis. Levels of MAP3K11 mRNA in the materials pulled down by biotin-miR-199a-5p (Bottom panel, left) and levels of total input mRNA (Bottom panel, right) measured by q-PCR. The enrichment of miR was calculated as follows: miR pull-down/control pull-down (X), miR input/control input (Y), Fold binding = X/Y. Representative bar diagram from three independent experiments. Each set of experiment was done in triplicate. Error bars represent mean ± S.D. and * stands for statistically significant based on two-tailed Student's t test where p < 0.05.
Figure 5
Figure 5. Contribution of potential miR-199a-5p binding sites in MAP3K11 mRNA
A. and B. Schematic representations of MAP3K11 luciferase reporter constructs containing 3′UTR fragments with individual predicted miR-199a-5p binding sites, (A) F1 and (B) F2. In addition, the sequence of the miR-199a-5p potential binding sites in MAP3K11 3′UTR fragments F1 (A) and F2 (B) were mutated by substituting 3 bases (underlined). Adjacent bar diagrams depict luciferase activity in the specified wild-type (WT) and mutant (Mut) MAP3K11 reporter constructs (10ng) following co-transfection with pre-miR-199a-5p (10 nM) or control miR in TE7 cells for 36 hours. Firefly luciferase activities were normalized to Renilla luciferase activities and expressed as the mean of three independent experiments. All experiments were carried out in triplicate. Error bars represent mean ± S.D. and * represents statistically significant p < 0.05, p values based on two-tailed Student's t test. C. Schematic representation of constructs of different MAP3K11 luciferase reporter constructs containing the full length 3′UTR (FL-3′UTR). (a) The binding sequences of both of the miR-199a-5p potential binding sites are intact in the full-length MAP3K11 3′UTR wild-type (WT) fragment. (b) The binding sequence of miR-199a-5p potential binding site 1 was mutated by substituting 3 bases (underlined) while potential binding site 2 remained intact. (c) The binding sequence of miR-199a-5p potential binding site 2 mutated by substituting 3 bases (underlined) while potential binding site 1 remained intact. (d) Binding sequences of both the predicted miR-199a-5p binding sites in the MAP3K11 full-length 3′UTR were mutated. D. Luciferase activities of the mutated constructs (10 ng) were compared to wild type following co-transfection with pre-miR-199a-5p (10 nM) or control miR in TE7 cells for 36 hours. Firefly luciferase activities were normalized to Renilla luciferase activities and expressed as the mean of three independent experiments. All experiments were carried out in triplicate. Error bars represent mean ± S.D. and * represents statistically significant p < 0.05, p values based on two-tailed Student's t test.
Figure 6
Figure 6. Overexpression of miR-199a-5p reduces proliferation and induces G2/M arrest in TE7 cells
A. Following transfection with pre-miR-199a 5p (10 nM) or control miR, TE7 cells were harvested at the indicated time points, and were incubated with MTT for 4 hours at 37°C. The resultant growth curves are plotted based on the MTT assay results. The value shown is the mean of three independent experiments. Error bars represent mean ± S.D. and * represents statistically significant p < 0.05, p values based on two-tailed Student's t test. B. DNA content analysis. Following transfection with pre-miR-199a-5p (10 nM) or control miR, TE7 cells were harvested at various time points, fixed in 70% ethanol, and stained with propidium iodide. Cells were subsequently analyzed by flow-cytometry. Representative cell cycle histograms of control (left column) verses treated (right column) cells are shown at (a) 48 hours, (b) 72 hours, and c. 96 hours following transfection. Peaks corresponding to 2n (G1) and 4n (G2/M) DNA content are marked. C. Comparison of the percentage of cells in G2/M phase at various time points following transfection with pre-miR-199a-5p or control miR. Results expressed as the mean of three independent experiments. Error bars represent mean ± S.D. and * represents statistical significance, p < 0.05, p values based on two-tailed Student's t test.
Figure 7
Figure 7. Effect of miR-199a-5p modulation on levels of c-jun and cyclin D1 (CCND1)
A. Forty-eight hours following transfection with pre-miR-199a-5p (10 nM) or control miR, whole cell lysates were isolated and subjected to western blot analysis with indicated antibodies. Changes in levels of cyclin D1, phosphorylated c-Jun, and total c-Jun protein expression are depicted in the immunoblots. The adjacent bar diagrams for relative protein signal intensity are the mean signal intensity of three separate immunoblots. Signal intensity of target protein is determined and is normalized by signal intensity of GAPDH. Relative signal intensity is calculated compared to control and is shown as bar diagram. Results represent the mean ± SD from three independent experiments, and * represents statistical significance based on two-tailed Student's t test (p < 0.05). B. Changes in levels of cyclin D1 mRNA in TE7 cells following transfection of pre-miR-199a-5p (10 nM) or control miR. In these experiments, 48 hours post-transfection, total RNA was extracted and levels of cyclin d1 were measured by q-PCR. Results represent the mean values of three biological and technical replicates. Error bars represents ± S.D. and statistical significance based on a two-tailed Student's t test is indicated by * (p < 0.05). C. Luciferase activity in reporter constructs containing the cyclin D1 promoter (100 ng) following co-transfection with Renilla luciferase (10 ng) and either pre-miR-199a-5p (10 nM) or control miR in TE7 cells for 36 hours. Firefly luciferase activities were normalized to Renilla luciferase activities and expressed as the mean of three independent experiments. All experiments were carried out in triplicate. Error bars represent mean ± S.D. and * represents statistically significant p < 0.05, p values based on two-tailed Student's t test. D. (a) Levels of cyclin D1 mRNA in the pull down material 48 hours following transfection with biotinylated-miR-199a-5p (50 nM) or control miR. The enrichment of miR was calculated as follows: miR pull-down/control pull-down (X), miR input/control input (Y), Fold binding = X/Y. Representative bar diagram from three independent experiments, each set of experiment was done in triplicates. Error bars represent mean ±S.D. and * stands for statistically significant based on two-tailed Student's t test where p < 0.05. (b) Levels of cyclin D1 mRNA in the total input mRNA.

Similar articles

Cited by

References

    1. Ferlay J, Soerjomataram I, Dikshit R, Eser S, Mathers C, Rebelo M, Parkin DM, Forman D, Bray F. Cancer incidence and mortality worldwide: sources, methods and major patterns in GLOBOCAN 2012. Int J Cancer. 2015;136:359–386. - PubMed
    1. Siegel RL, Miller KD, Jemal A. Cancer statistics, 2015. CA Cancer J Clin. 2015;65:5. - PubMed
    1. Di Leva G, Garofalo M, Croce CM. MicroRNAs in cancer. Annu Rev Pathol. 2014;9:287–314. - PMC - PubMed
    1. Keene JD. RNA regulons: coordination of post-transcriptional events. Nat Rev Genet. 2007;8:533–543. - PubMed
    1. Kent OA, Mendell JT. A small piece in the cancer puzzle: microRNAs as tumor suppressors and oncogenes. Oncogene. 2006;25:6188–6196. - PubMed

Publication types

MeSH terms