. 2015 Dec 30;11(12):e1004613.
doi: 10.1371/journal.pcbi.1004613. eCollection 2015 Dec.

Epidemic Reconstruction in a Phylogenetics Framework: Transmission Trees as Partitions of the Node Set

Affiliations

Epidemic Reconstruction in a Phylogenetics Framework: Transmission Trees as Partitions of the Node Set

Matthew Hall et al. PLoS Comput Biol. .

Abstract

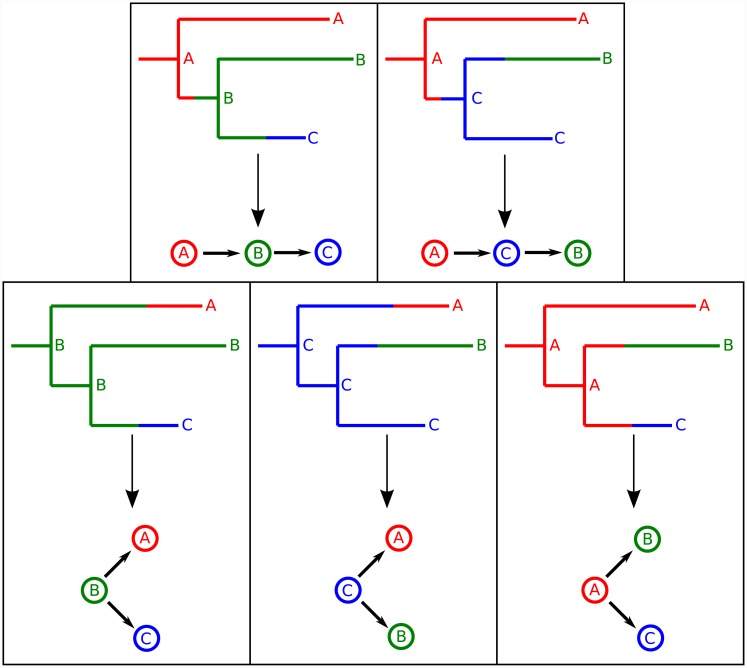
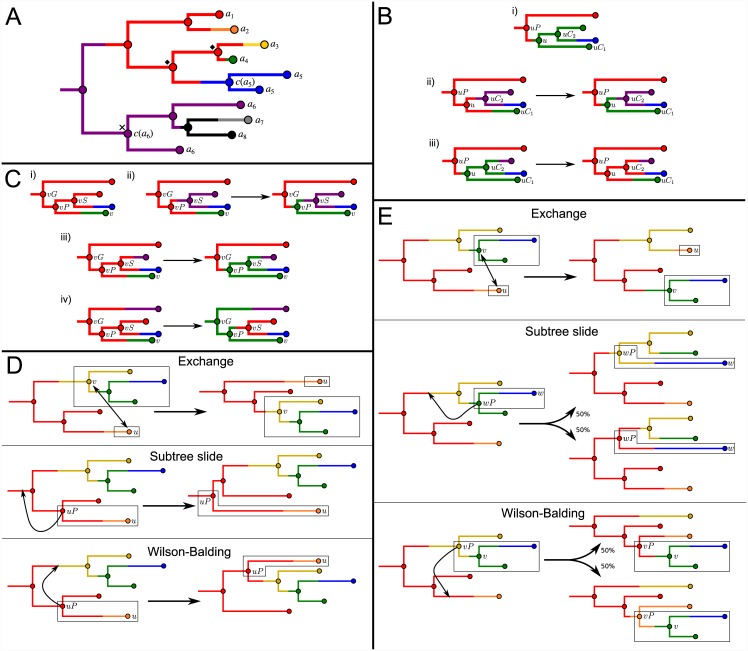
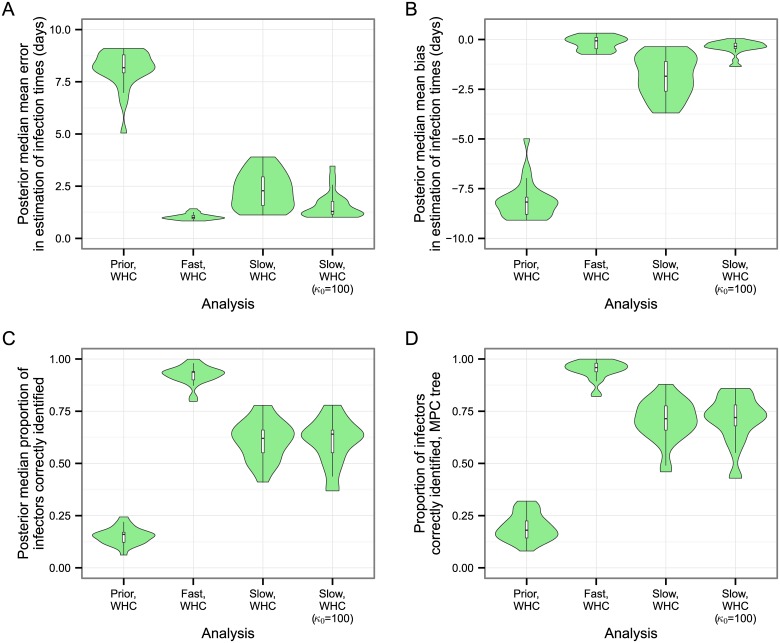
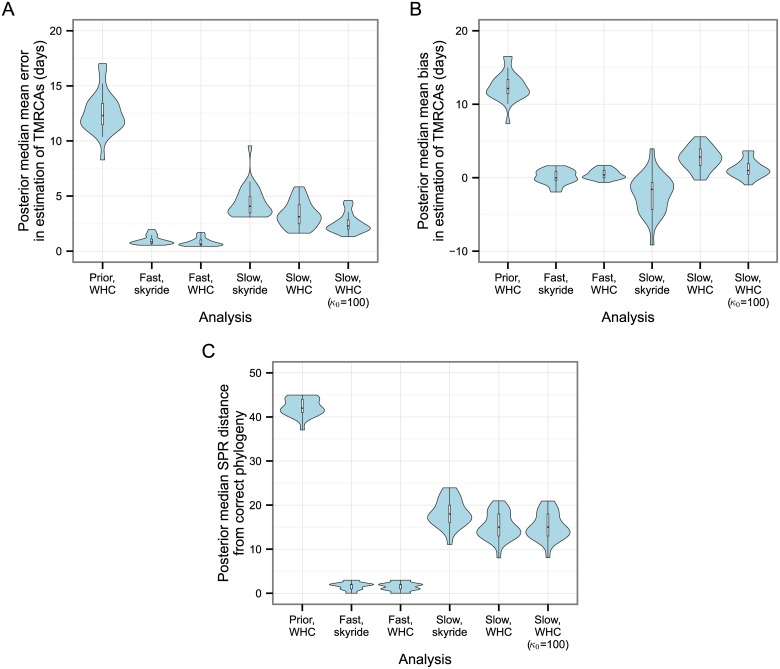
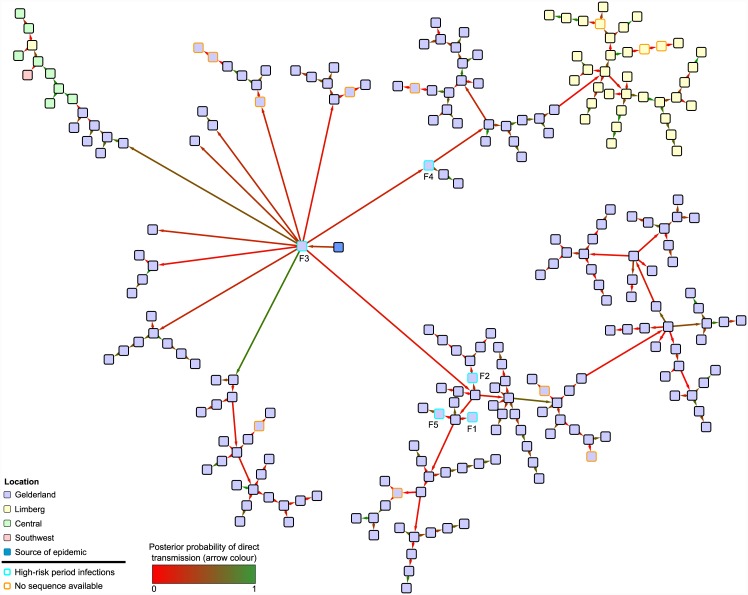
The use of genetic data to reconstruct the transmission tree of infectious disease epidemics and outbreaks has been the subject of an increasing number of studies, but previous approaches have usually either made assumptions that are not fully compatible with phylogenetic inference, or, where they have based inference on a phylogeny, have employed a procedure that requires this tree to be fixed. At the same time, the coalescent-based models of the pathogen population that are employed in the methods usually used for time-resolved phylogeny reconstruction are a considerable simplification of epidemic process, as they assume that pathogen lineages mix freely. Here, we contribute a new method that is simultaneously a phylogeny reconstruction method for isolates taken from an epidemic, and a procedure for transmission tree reconstruction. We observe that, if one or more samples is taken from each host in an epidemic or outbreak and these are used to build a phylogeny, a transmission tree is equivalent to a partition of the set of nodes of this phylogeny, such that each partition element is a set of nodes that is connected in the full tree and contains all the tips corresponding to samples taken from one and only one host. We then implement a Monte Carlo Markov Chain (MCMC) procedure for simultaneous sampling from the spaces of both trees, utilising a newly-designed set of phylogenetic tree proposals that also respect node partitions. We calculate the posterior probability of these partitioned trees based on a model that acknowledges the population structure of an epidemic by employing an individual-based disease transmission model and a coalescent process taking place within each host. We demonstrate our method, first using simulated data, and then with sequences taken from the H7N7 avian influenza outbreak that occurred in the Netherlands in 2003. We show that it is superior to established coalescent methods for reconstructing the topology and node heights of the phylogeny and performs well for transmission tree reconstruction when the phylogeny is well-resolved by the genetic data, but caution that this will often not be the case in practice and that existing genetic and epidemiological data should be used to configure such analyses whenever possible. This method is available for use by the research community as part of BEAST, one of the most widely-used packages for reconstruction of dated phylogenies.


Conflict of interest statement

The authors have declared that no competing interests exist.

Figures

Fig 1
Fig 1. The five possible transmission tree structures of a phylogenetic tree with three tips, depicted as partitions of the nodes of a phylogeny (above) and as directed graphs amongst the hosts A, B and C (below).
Fig 2
Fig 2. Illustrations of partitioned phylogenies and MCMC proposals modifying them.
Nodes in all cases are coloured by the partition element containing them. (A) An example partitioned phylogeny. Tips are labelled by the hosts that the isolates corresponding to them were taken from. Where more than one isolate is taken from a host a i, c(a i) is labelled; in all other cases c(a i) is the single tip corresponding to an isolate taken from that host. Black diamonds designate nodes that are not ancestral under the partition. The hosts a 7 and a 8 are root-blocked by a 6 due to the position of c(a 6) (black cross). (B) The downward infection branch move. The move attempts to move the node u from the green partition element to the red (which already contains its parent uP). In i), the move is impossible because u is the MRCA node of the tips in the green element. In ii), it can be done with no further modifications required to obey the rules. In iii), the node uC 2, which is not ancestral under the initial partition, must also be moved to the red element so the result obeys the rules. (C) The upward infection branch move. The move attempts to move the node vP from the red partition element to the green (which already contains its child v). In i), the move is impossible because vP is ancestral under the partition and the host represented by the green element is root-blocked by the host represented by the red. In ii), it can be done with no further modifications required to obey the rules. In iii), the node vS, which is not ancestral under the initial partition, must also be moved to the green element, and in iv) the node vG must be because vS is ancestral. (D) The type A phylogeny moves. The exchange move exchanges the nodes u and v; the subtree slide and Wilson-Balding moves change the position of the node u and its parent uP. (E) The type B phylogeny moves. The exchange move exchanges the nodes u and v; the subtree slide move the node w and its parent wP, and the Wilson-Balding the node v and its parent vP. After the latter two moves the transplanted parent node is randomly assigned to one of two new partition elements with equal probability.
Fig 3
Fig 3. Accuracy of the reconstruction of the transmission tree.
Each violin plot represents the density of a statistic calculated from the results of separate analyses of 25 simulated datasets; the clock model used to generate the dataset and the analysis method are indicated on the y-axis. (A) posterior median of mean bias in estimation of infection dates. (B) posterior median of mean error in estimation of infection dates. (C) Posterior median proportion of hosts whose infector is correctly identified. (D) Proportion of hosts whose infector is correctly identified in the maximum parent credibility (MPC) transmission tree.
Fig 4
Fig 4. Accuracy of the reconstruction of the phylogeny. Each violin plot represents the density of a statistic calculated from the results of separate analyses of 25 simulated datasets; the clock model used to generate the dataset and the analysis method are indicated on the y-axis.
(A) posterior median of mean bias in estimation of all pairwise TMRCAs. (B) posterior median of mean error in estimation of all pairwise TMRCAs. (C) Posterior median SPR distance from the true phylogeny.
Fig 5
Fig 5. Maximum parent credibility transmission tree for the H7N7 outbreak.
Nodes represent farms and are coloured by geographical region. Arrows represent direct transmissions and are coloured by the posterior probability of this particular direct infection. The cyan-bordered nodes, which are also labelled with farm ID numbers from previous literature [18], are were detected during the “high-risk” period before the implementation of control measures. Orange-bordered nodes are farms for which no sequence was available.

References

    1. Liu J, Lim SL, Ruan Y, Ling AE, Ng LFP, Drosten C, et al. SARS transmission pattern in Singapore reassessed by viral sequence variation analysis. PLOS Med. 2005;2:e43 10.1371/journal.pmed.0020043 - DOI - PMC - PubMed
    1. Spada E, Sagliocca L, Sourdis J, Garbuglia AR, Poggi V, Fusco CD, et al. Use of the minimum spanning tree model for molecular epidemiological investigation of a nosocomial outbreak of hepatitis C virus infection. J Clin Microbiol. 2004;42:4230–4236. 10.1128/JCM.42.9.4230-4236.2004 - DOI - PMC - PubMed
    1. Aldrin M, Lyngstad TM, Kristoffersen AB, Storvik B, Borgan Ø, Jansen PA. Modelling the spread of infectious salmon anaemia among salmon farms based on seaway distances between farms and genetic relationships between infectious salmon anaemia virus isolates. J Roy Soc Interface. 2011;8:1346–1356. 10.1098/rsif.2010.0737 - DOI - PMC - PubMed
    1. Jombart T, Eggo RM, Dodd PJ, Balloux F. Reconstructing disease outbreaks from genetic data: a graph approach. Heredity. 2011;106:383–390. 10.1038/hdy.2010.78 - DOI - PMC - PubMed
    1. Cottam EM, Thébaud G, Wadsworth J, Gloster J, Mansley L, Paton DJ, et al. Integrating genetic and epidemiological data to determine transmission pathways of foot-and-mouth disease virus. P Roy Soc B. 2008;275:887–895. 10.1098/rspb.2007.1442 - DOI - PMC - PubMed

Publication types