. 2016 Feb;37(2):206-14.
doi: 10.1093/carcin/bgv250. Epub 2015 Dec 30.

Homeostatic responses of colonic LGR5+ stem cells following acute in vivo exposure to a genotoxic carcinogen

Affiliations

Homeostatic responses of colonic LGR5+ stem cells following acute in vivo exposure to a genotoxic carcinogen

Eunjoo Kim et al. Carcinogenesis. 2016 Feb.

Abstract

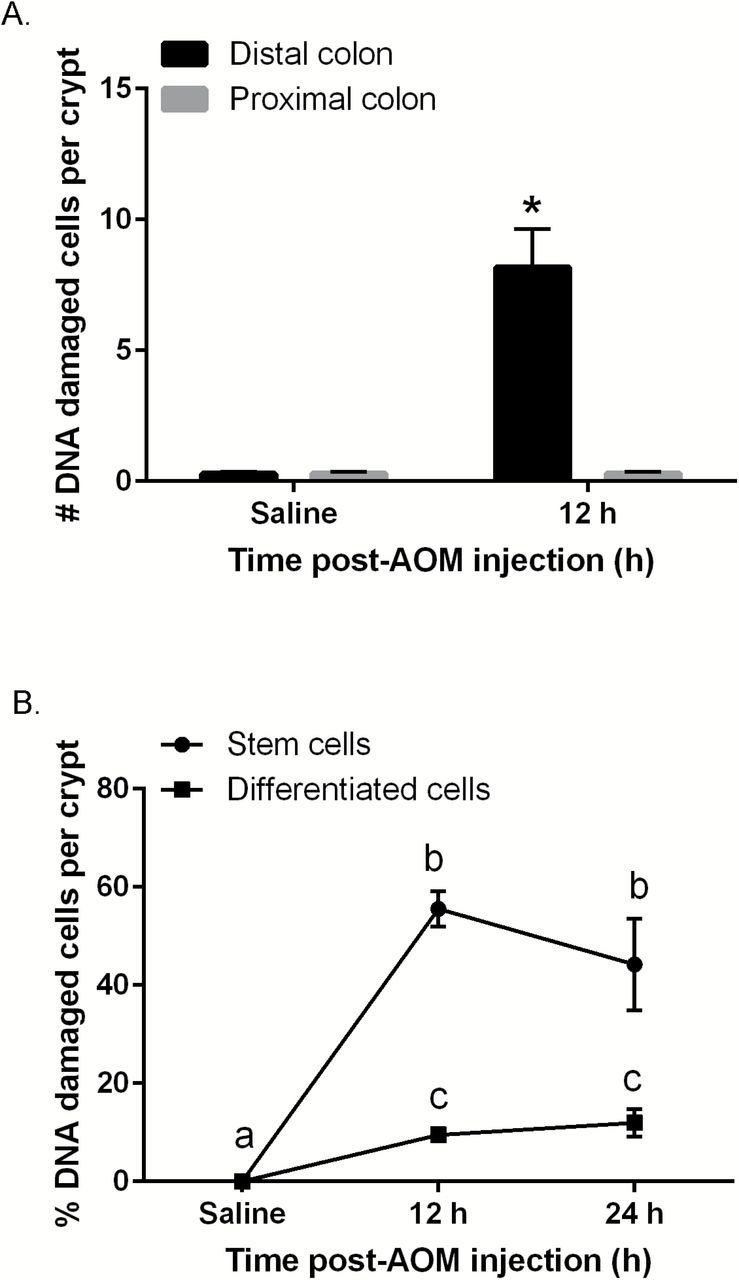
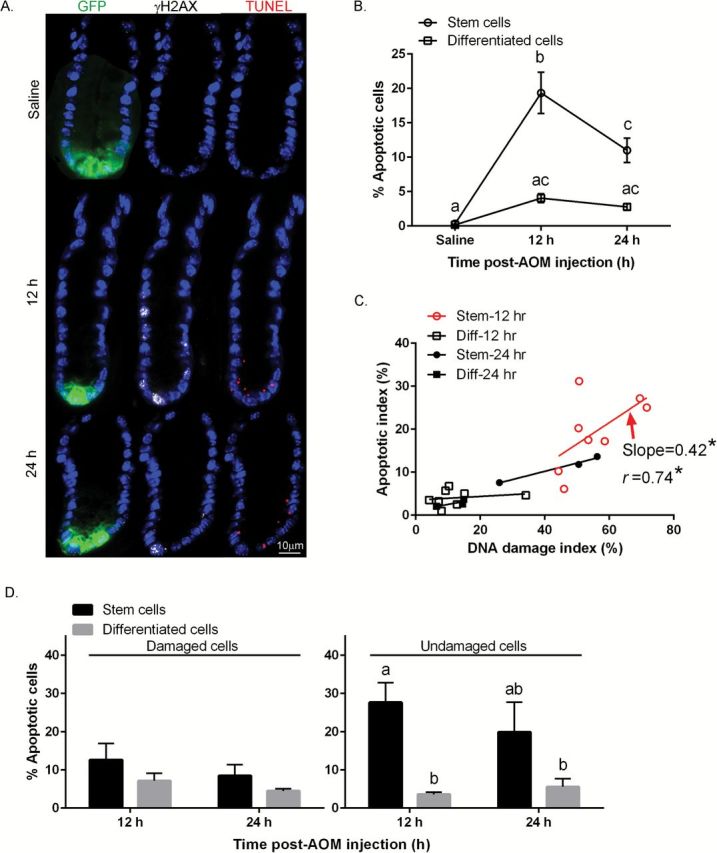
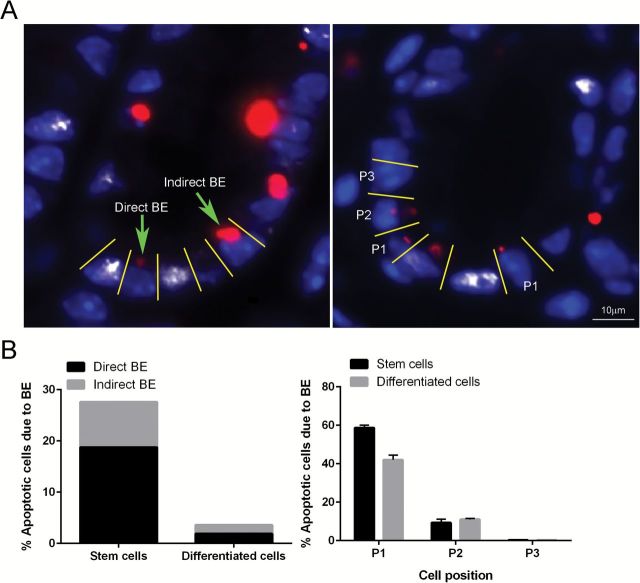
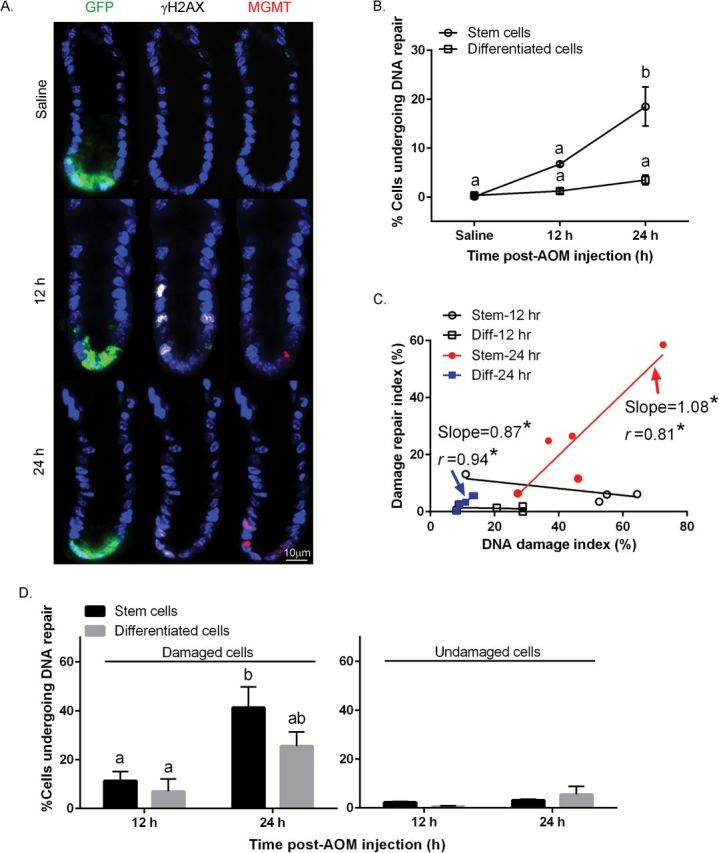
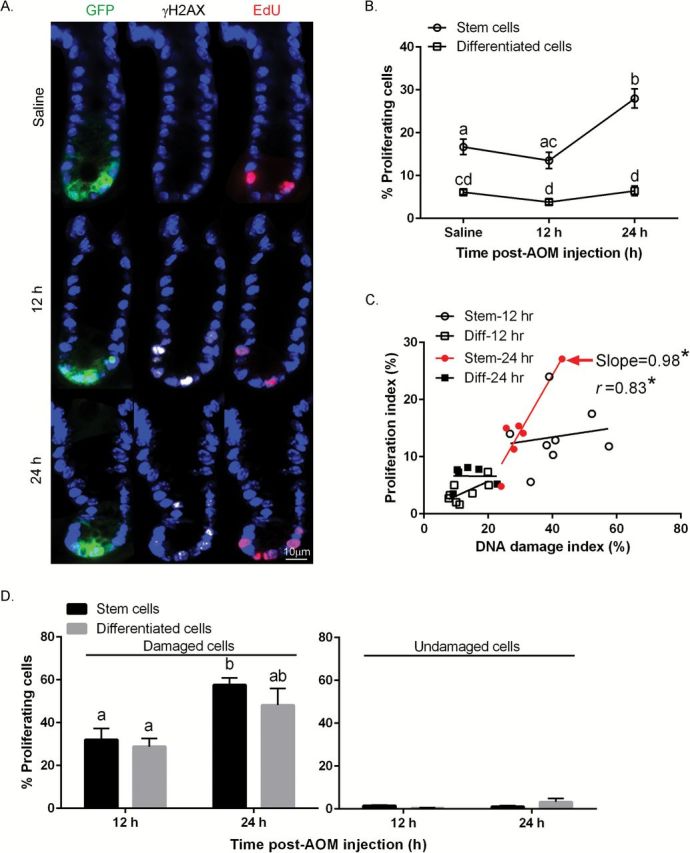
Perturbations in DNA damage, DNA repair, apoptosis and cell proliferation in the base of the crypt where stem cells reside are associated with colorectal cancer (CRC) initiation and progression. Although the transformation of leucine-rich repeat-containing G protein-coupled receptor 5 (Lgr5)(+) cells is an extremely efficient route towards initiating small intestinal adenomas, the role of Lgr5(+) cells in CRC pathogenesis has not been well investigated. Therefore, we further characterized the properties of colonic Lgr5(+) cells compared to differentiated cells in Lgr5-EGFP-IRES-creER(T2) knock-in mice at the initiation stage of carcinogen azoxymethane (AOM)-induced tumorigenesis using a quantitative immunofluorescence microscopy approach. At 12 and 24h post-AOM treatment, colonic Lgr5(+) stem cells (GFP(high)) were preferentially damaged by carcinogen, exhibiting a 4.7-fold induction of apoptosis compared to differentiated (GFP(neg)) cells. Furthermore, with respect to DNA repair, O(6)-methylguanine DNA methyltransferase (MGMT) expression was preferentially induced (by 18.5-fold) in GFP(high) cells at 24h post-AOM treatment compared to GFP(neg) differentiated cells. This corresponded with a 4.3-fold increase in cell proliferation in GFP(high) cells. These data suggest that Lgr5(+) stem cells uniquely respond to alkylation-induced DNA damage by upregulating DNA damage repair, apoptosis and cell proliferation compared to differentiated cells in order to maintain genomic integrity. These findings highlight the mechanisms by which colonic Lgr5(+) stem cells respond to cancer-causing environmental factors.


Figures

Figure 1.
Figure 1.
Carcinogen (AOM)-induced DNA DSBs in mouse colonic crypts at 12 and 24h post-AOM injection (% of saline control). (A) Quantitative comparison of the number of γH2AX+ (DNA damaged) cells per crypt in the distal and proximal colon in saline versus AOM injected mice. (B) Quantitative comparison of the % of γH2AX+ stem cells (GFPhigh) and differentiated cells (GFPneg) per crypt. A total of 426 Lgr5 GFP+ crypts from eight mice were counted at 12h, 150 Lgr5 GFP+ crypts from three mice were counted at 24h and 150 crypts from three saline control mice were examined. DAPI stained nuclei along the mouse colonic crypt were counted and stem cells were determined by counting cells double stained for GFP and DAPI within Lgr5 GFP+ crypts. Statistically significant differences between time points were determined using two-way ANOVA followed by Fisher’s LSD multiple comparison testing. Different letters or * indicate significant differences between treatment groups (P < 0.05).
Figure 2.
Figure 2.
Comparison of AOM-induced apoptosis in stem cells and differentiated cells. (A) Representative images (objective, 40×) of GFP+ (GFPhigh stem cells, green), γH2AX+ (DSBs, white) and TUNEL+ (apoptotic body, red) cells are shown. For comparative purposes, immunofluorescence staining of colonic crypts in the distal colon in saline (control) and AOM injected mice is shown. (B) % TUNEL+ (apoptotic) stem cells and differentiated cells per crypt. (C) Association between the % of AOM-induced apoptotic cells and % of γH2AX+ cells per crypt in stem and differentiated (Diff) cells. Each point represents an individual animal. The P value was calculated using an F test. Correlation computes the value of the Pearson correlation coefficient, r, ranges from −1 to +1. The linear regression was fitted using GraphPad Prism 6.0. Apoptotic index = # of TUNEL+ stem or differentiated cells/total # of stem or differentiated cells per crypt X 100 at 12 and 24h post-AOM injection; Damage index = # of γH2AX+ stem or differentiated cells/total # of stem or differentiated cells per crypt X 100 at 12 and 24h post-AOM injection. Slope where the difference from zero is statistically significant is marked in red (Stem, 12h). (D) (left panel) % targeted apoptosis (double positive TUNEL+ and γH2AX+ stem or differentiated cells/γH2AX+ stem or differentiated cells) at 12 and 24h post-AOM injection; (right panel) % nontargeted apoptosis (TUNEL+ and γH2AX stem or differentiated cells/γH2AX stem or differentiated cells) at 12 and 24h post-AOM injection. Different letters or * indicate significant differences between treatment groups (P < 0.05). Refer to Figure 1 legend for animal numbers.
Figure 3.
Figure 3.
(A) Representative image of direct BE (apoptotic cell located one or two cells away from damaged cell) and indirect BE (apoptotic cells with no damaged cells in the field of interest) at 12h post-AOM injection. An apoptotic cell immediately adjacent to a damaged cell is defined as P1; an apoptotic cell located one cell away from a damaged cell is defined as P2 (right). Representative images (objective, 40×) of TUNEL+ (apoptotic body, red) cells next to γH2AX+ (DSBs, white) cells are shown counter-stained with DAPI (blue). (B) Percentage of BE-dependent and BE-independent apoptotic Lgr5+ stem versus differentiated cells (left) and percentage of BE-dependent apoptotic cells in relation to its proximity to a damaged cell.
Figure 4.
Figure 4.
Comparison of AOM-induced MGMT expression in stem cells and differentiated cells. (A) Representative images (objective, 40×) of GFP+ (Lgr5+ stem cells), γH2AX+ (DSBs) and MGMT+ (repair enzyme) cells are shown. For comparative purposes, immunofluorescence staining of colonic crypt in the distal colon in saline (control) and AOM injected mice is shown. (B) % MGMT+ stem cells and differentiated cells per crypt. (C) Association between the % of AOM-induced MGMT+ (DNA repair) cells and % of γH2AX+ cells per crypt in stem and differentiated (Diff) cells. Repair index = # of MGMT+ stem or differentiated cells/total # of stem or differentiated cells per crypt X 100 at 12 and 24h post-AOM injection; DNA damage index = # of γH2AX+ stem or differentiated cells/total # of stem or differentiated cells per crypt X 100 at 12 and 24h post-AOM injection. Slope where the difference from zero is statistically significant is marked in red (Stem, 24h) or blue (Diff, 24h). (D) (left panel) % of γH2AX+ cells expressing MGMT (both γH2AX+ and MGMT+ stem or differentiated cells/γH2AX+ stem or differentiated cells) at 12 and 24h (right) post-AOM injection; (right panel) % of γH2AX cells expressing MGMT (both γH2AX and MGMT+ stem or differentiated cells/γH2AX stem or differentiated cells) at 12 and 24h post-AOM injection. Different letters or * indicate significant differences between treatment groups (P < 0.05). Refer to Figure 1 legend for animal numbers.
Figure 5.
Figure 5.
Comparison of AOM-induced proliferation in stem cells and differentiated cells. (A) Representative images (objective, 40×) of GFP+ (Lgr5+ stem cells), γH2AX+ (DSBs) and EdU+ (proliferation) cells are shown. For comparative purposes, immunofluorescence staining of colonic crypts in the distal colon in saline (control) and AOM injected mice is shown. (B) % EdU+ stem cells and differentiated cells per crypt. (C) Association between the % of AOM-induced proliferating cells and % of γH2AX+ cells per crypt in both stem and differentiated (Diff) cells. Proliferating index = # of EdU+ stem or differentiated cells/total # of stem or differentiated cells per crypt X 100 at 12 and 24h post-AOM injection; DNA damage index = # of γH2AX+ stem or differentiated cells/total # of stem or differentiated cells per crypt X 100 at 12 and 24h post-AOM injection. Slope where the difference from zero is statistically significant is marked in red (stem, 24h). (D) (left panel) % of γH2AX+ cells also positive for EdU (both γH2AX+ and EdU+ stem or differentiated cells/γH2AX+ stem or differentiated cells) at 12 and 24h post-AOM injection; (right panel) % of γH2AX cells positive for EdU (both γH2AX and EdU+ stem or differentiated cells/γH2AX stem or differentiated cells) at 12 and 24h post-AOM injection. Different letters or * indicate significant differences between treatment groups (P < 0.05). Refer to Figure 1 legend for animal numbers.

Similar articles

Cited by

References

    1. Barker N., et al. (2009) Crypt stem cells as the cells-of-origin of intestinal cancer. Nature, 457, 608–611. - PubMed
    1. Li Q., et al. (2011) The response of intestinal stem cells and epithelium after alemtuzumab administration. Cell. Mol. Immunol., 8, 325–332. - PMC - PubMed
    1. Asfaha S., et al. (2015) Krt19(+)/Lgr5(-) cells are radioresistant cancer-initiating stem cells in the colon and intestine. Cell Stem Cell, 16, 627–638. - PMC - PubMed
    1. Sato T., et al. (2009) Single Lgr5 stem cells build crypt-villus structures in vitro without a mesenchymal niche. Nature, 459, 262–265. - PubMed
    1. Schepers A.G., et al. (2011) Lgr5 intestinal stem cells have high telomerase activity and randomly segregate their chromosomes. EMBO J., 30, 1104–1109. - PMC - PubMed

Publication types

MeSH terms