Comparative Study
. 2016 Jan 22;469(4):967-77.
doi: 10.1016/j.bbrc.2015.12.083. Epub 2015 Dec 22.

Analysis of the microbiome: Advantages of whole genome shotgun versus 16S amplicon sequencing

Affiliations
Comparative Study

Analysis of the microbiome: Advantages of whole genome shotgun versus 16S amplicon sequencing

Ravi Ranjan et al. Biochem Biophys Res Commun. .

Abstract

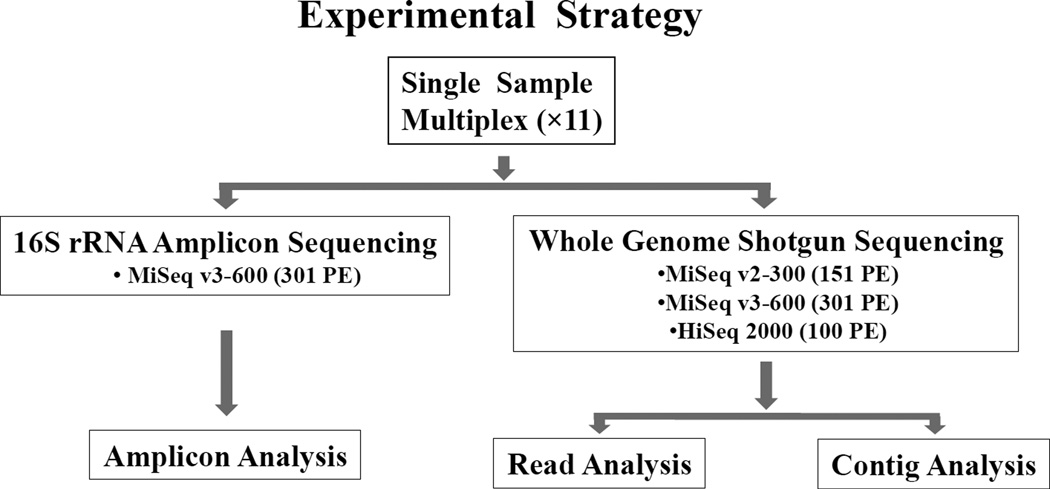
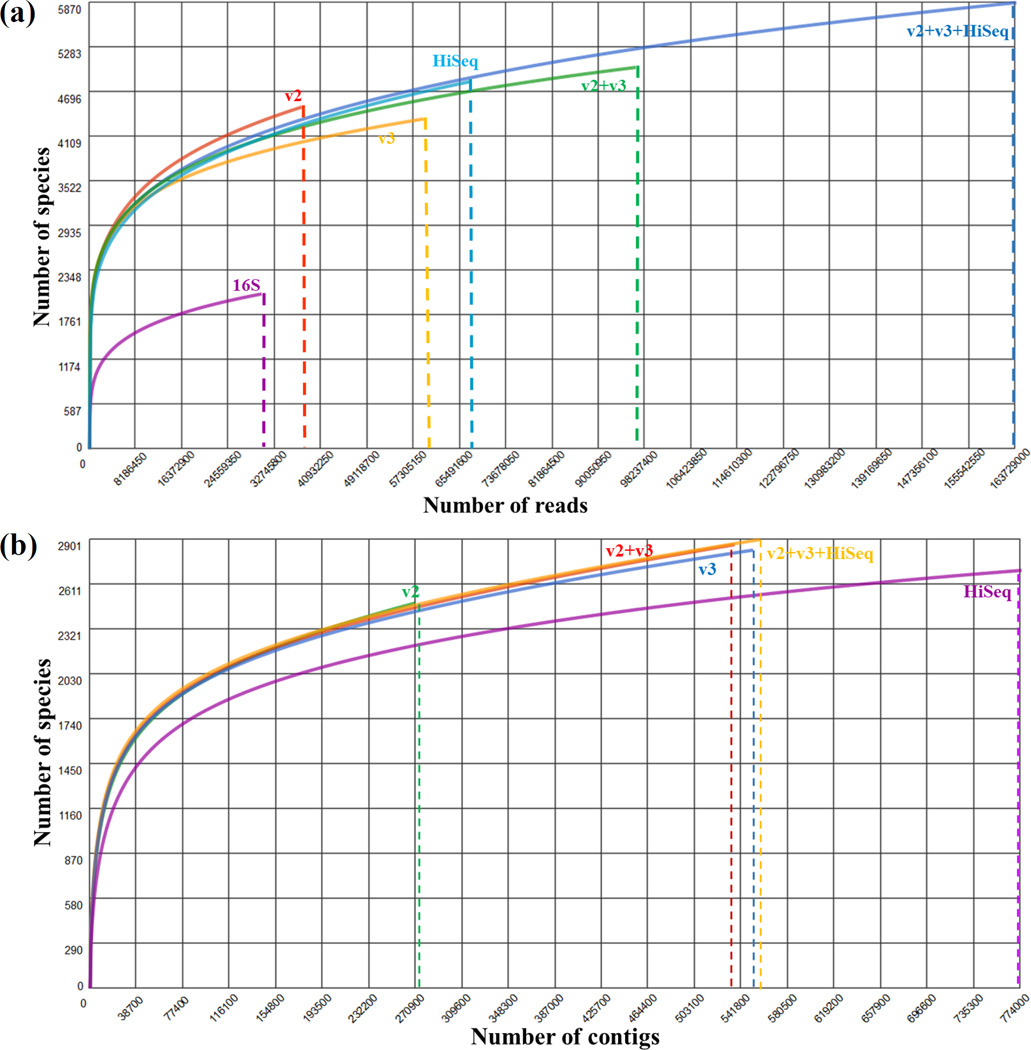
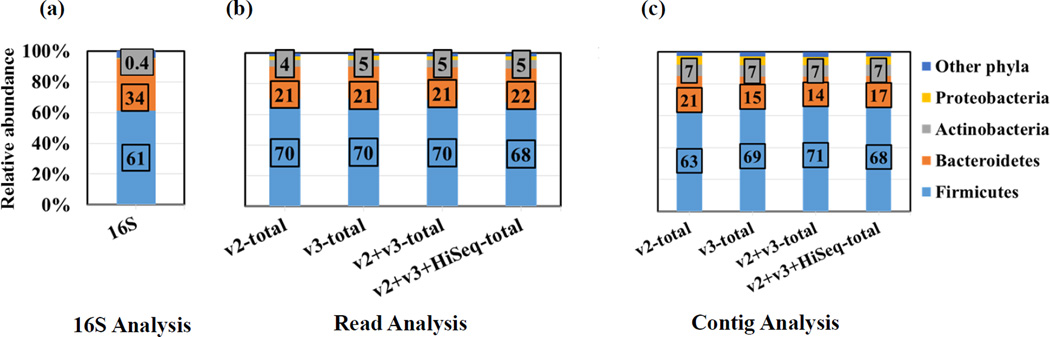
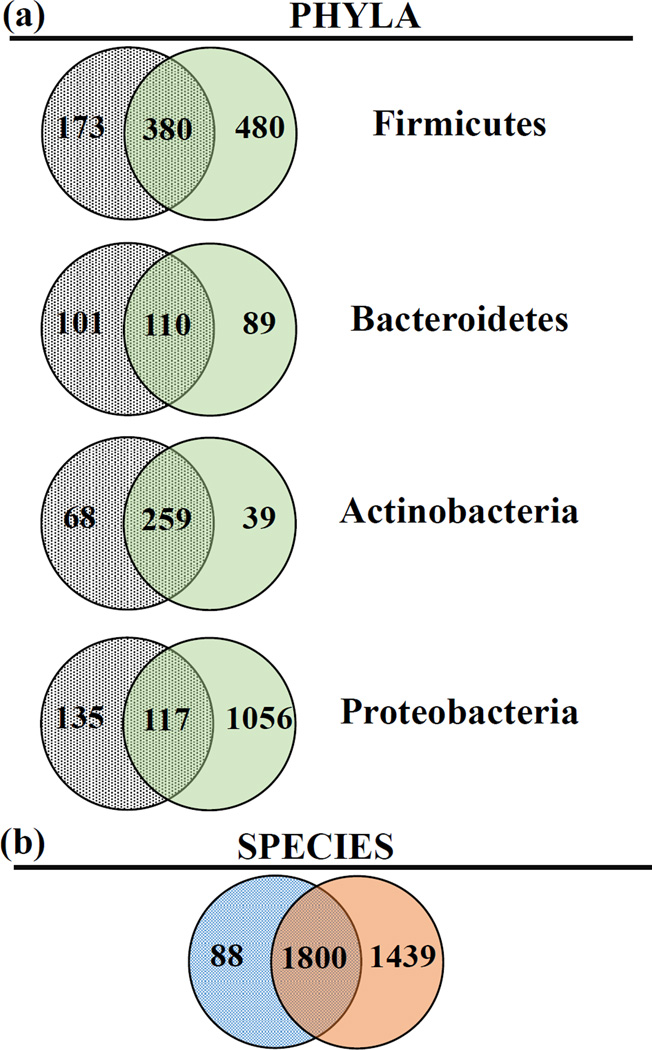
The human microbiome has emerged as a major player in regulating human health and disease. Translational studies of the microbiome have the potential to indicate clinical applications such as fecal transplants and probiotics. However, one major issue is accurate identification of microbes constituting the microbiota. Studies of the microbiome have frequently utilized sequencing of the conserved 16S ribosomal RNA (rRNA) gene. We present a comparative study of an alternative approach using whole genome shotgun sequencing (WGS). In the present study, we analyzed the human fecal microbiome compiling a total of 194.1 × 10(6) reads from a single sample using multiple sequencing methods and platforms. Specifically, after establishing the reproducibility of our methods with extensive multiplexing, we compared: 1) The 16S rRNA amplicon versus the WGS method, 2) the Illumina HiSeq versus MiSeq platforms, 3) the analysis of reads versus de novo assembled contigs, and 4) the effect of shorter versus longer reads. Our study demonstrates that whole genome shotgun sequencing has multiple advantages compared with the 16S amplicon method including enhanced detection of bacterial species, increased detection of diversity and increased prediction of genes. In addition, increased length, either due to longer reads or the assembly of contigs, improved the accuracy of species detection.

Keywords: 16S rRNA; Amplicon sequencing; Metagenomics; Microbiome; Microbiota; Next-generation sequencing; Whole genome shotgun sequencing.


Conflict of interest statement

COMPETING FINANCIAL INTERESTS:

The authors have declared that no conflict of interest exists.

Figures

Figure 1
Figure 1. Experimental strategy to compare sequencing methods, platforms and data analysis
Experimental design for 16S rRNA amplicon and WGS sequencing for a single fecal sample multiplexed in 11 libraries is shown. 16S amplicon sequencing was performed using MiSeq v3–600 and WGS sequencing was performed using MiSeq v2–300, MiSeq v3–600 and HiSeq 2000. The 16S data was analyzed using OTU based amplicon approach and the WGS read and contig data were analyzed using the MG-RAST M5NR and NCBI nt database.
Figure 2
Figure 2. Rarefaction curves of combined reads and contigs
Rarefaction curve for 16S amplicon, HiSeq, v2, v3, v2+v3 and v2+v3+HiSeq data using a read-based analysis (a) and for HiSeq, v2-total, v3-total, v2+v3-total and v2+v3+HiSeq-total data using a contig-based analysis (b). Graph shows total number reads or contigs (x-axis) and total number of species identified (y-axis). Vertical dashed lines mark the number of reads or contigs detected for each dataset.
Figure 3
Figure 3. Relative abundance of bacterial phyla
Stacked bar graph of relative abundance of bacterial phyla identified in 16S amplicon based analysis (a), read-based analysis of WGS data (b) and contig-based analysis of WGS data (c) in the v2-total, v3-total, v2+v3-total and v2+v3+HiSeq-total datasets. Relative abundance (y-axis) of the dominant bacterial phyla includes Firmicutes, Bacteroidetes, Actinobacteria and Proteobacteria. The “other phyla” for 16S amplicon analysis contains 19 non-abundant phyla and unclassified bacteria representing <5% of total abundance. The “other phyla” for the WGS analysis contains 27 non-abundant phyla and unclassified bacteria representing <2% of total abundance.
Figure 4
Figure 4. Comparison of taxa identified by different sequencing and analysis methods
Number of species identified in the four predominant phyla identified in the 16S rRNA amplicon (grey) and in the WGS v2+v3+HiSeq-total read (green) datasets (a). The union of species for the Firmicutes (37%), Bacteroidetes (37%), Actinobacteria (32%) and Proteobacteria (9%) is shown in the overlap. A comparison of total species detection using a contig-based analysis ( blue) versus a read-based analysis ( orange) shows overlap in species detection of 54% (b).
Figure 5
Figure 5. Greater diversity detected with the WGS than 16S method
Bar chart of Shannon diversity index calculated at species level from 16S, HiSeq, v2-total, v3-total, v2+v3-total and v2+v3+HiSeq-total datasets. The diversity of the WGS datasets was analyzed on de novo assembled contigs. Read based and contig based methods showed consistent and reproducible diversity index values among the samples.
Figure 6
Figure 6. Comparison of coverage of a representative genome using read-based versus contig-based analysis
Genome recruitment plots of a representative reference genome, Faecalibacterium prausnitzii, using a read-based (left) versus a contig-based (right) analysis of the v2+v3+HiSeq-total dataset. Circular plots were created using the MG-RAST genome recruitment tool using a maximum e-value of 1e−3 and a log2 abundance scale. The leading and lagging strands are represented by the outer and inner most rings, separated by the blue ring, which indicates the position within the genome. Metagenomic features are depicted as bar graphs inside the genome. The greater height represent more mapped features and the e-value exponent is color-coded as blue (−3 to −5), green (−5 to −10), yellow (−10 to −20), orange (−20 to −30) and red (less than −30).

Similar articles

Cited by

References

    1. Pflughoeft KJ, Versalovic J. Human microbiome in health and disease. Annu. Rev. Pathol. 2012;7:99–122. - PubMed
    1. Cho I, Blaser MJ. The human microbiome: at the interface of health and disease. Nat. Rev. Genet. 2012;13:260–270. - PMC - PubMed
    1. Kelly CP. Fecal microbiota transplantation — An old therapy comes of age. N. Engl. J. Med. 2013;368:474–475. - PubMed
    1. Vrieze A, Van Nood E, Holleman F, Salojarvi J, Kootte RS, Bartelsman JF, Dallinga-Thie GM, Ackermans MT, Serlie MJ, Oozeer R, Derrien M, Druesne A, Van Hylckama Vlieg JE, Bloks VW, Groen AK, Heilig HG, Zoetendal EG, Stroes ES, de Vos WM, Hoekstra JB, Nieuwdorp M. Transfer of intestinal microbiota from lean donors increases insulin sensitivity in individuals with metabolic syndrome. Gastroenterology. 2012;143:913–916. e917. - PubMed
    1. Ratner M. Fecal transplantation poses dilemma for FDA. Nat. Biotechnol. 2014;32:401–402. - PubMed

Publication types