. 2016 Mar;65(3):780-93.
doi: 10.2337/db15-0564. Epub 2015 Dec 30.

An Essential Role of NRF2 in Diabetic Wound Healing

Affiliations

An Essential Role of NRF2 in Diabetic Wound Healing

Min Long et al. Diabetes. 2016 Mar.

Abstract

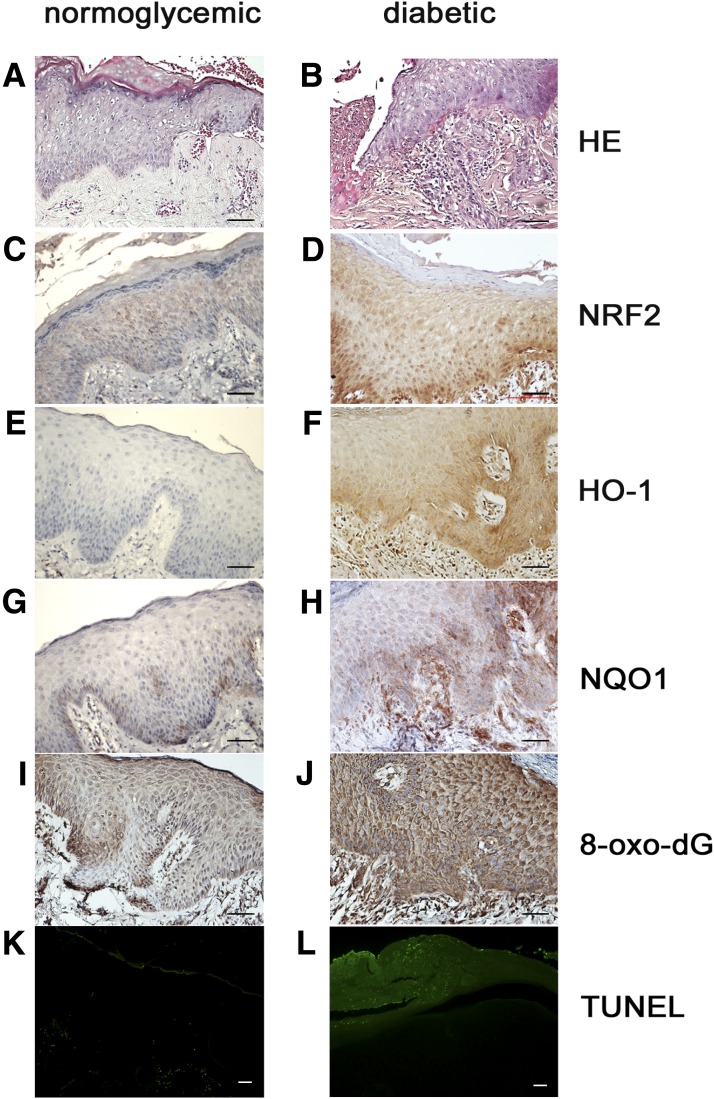
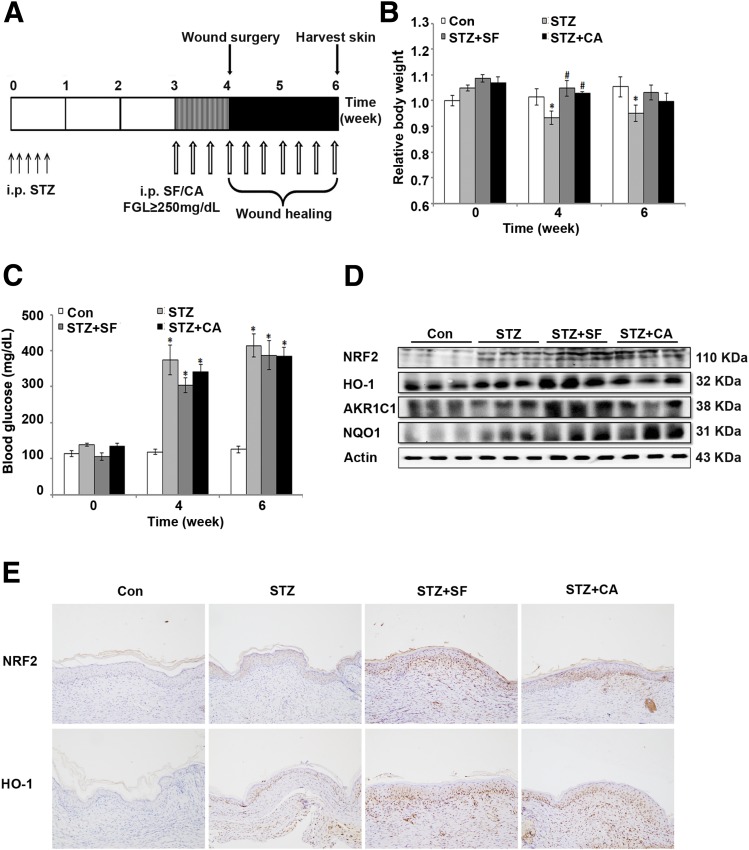
The high mortality and disability of diabetic nonhealing skin ulcers create an urgent need for the development of more efficacious strategies targeting diabetic wound healing. In the current study, using human clinical specimens, we show that perilesional skin tissues from patients with diabetes are under more severe oxidative stress and display higher activation of the nuclear factor-E2-related factor 2 (NRF2)-mediated antioxidant response than perilesional skin tissues from normoglycemic patients. In a streptozotocin-induced diabetes mouse model, Nrf2(-/-) mice have delayed wound closure rates compared with Nrf2(+/+) mice, which is, at least partially, due to greater oxidative DNA damage, low transforming growth factor-β1 (TGF-β1) and high matrix metalloproteinase 9 (MMP9) expression, and increased apoptosis. More importantly, pharmacological activation of the NRF2 pathway significantly improves diabetic wound healing. In vitro experiments in human immortalized keratinocyte cells confirm that NRF2 contributes to wound healing by alleviating oxidative stress, increasing proliferation and migration, decreasing apoptosis, and increasing the expression of TGF-β1 and lowering MMP9 under high-glucose conditions. This study indicates an essential role for NRF2 in diabetic wound healing and the therapeutic benefits of activating NRF2 in this disease, laying the foundation for future clinical trials using NRF2 activators in treating diabetic skin ulcers.


Figures

Figure 1
Figure 1
Perilesional skin tissues of patients with diabetes are under severe oxidative damage that activates the NRF2-mediated antioxidant response. Human skin tissue samples from 11 normoglycemic patients and 12 patients with diabetes (see Supplementary Table 1 for details) were fixed and paraffin embedded; the tissue sections were subjected to H-E staining (A and B) and IHC analysis (CJ) with the indicated antibodies (original magnification ×200). Apoptotic cells in the tissue were detected by TUNEL assay (K and L) (original magnification ×100). Representative images from the perilesional skin tissues of wounds are shown. Scale bar, 100 μm.
Figure 2
Figure 2
SF and CA activate NRF2 in skin tissues of STZ mice. A: Timeline for treatments, surgery, and wound healing assessment in mice. Diabetic mice were generated by STZ injections as described above; nondiabetic controls were injected with sodium citrate instead of STZ. Three weeks later, all mice became diabetic (FGL ≥250 mg/dL) and were randomly allocated into STZ or STZ + treatment (SF or CA) groups. All animals received compounds or corn oil every other day until the end of the experiment. Wound surgeries were performed after 1 week of compound treatments; 2 weeks later, the wound skin tissues were harvested. Groups: nondiabetic control (Con, n = 8); diabetic: untreated (STZ, n = 5), SF treated (STZ+SF, n = 5), and CA treated (STZ+CA, n = 6). Relative body weight (B) and blood glucose concentration (C). Data were analyzed by ANOVA and Tukey post hoc test. Results are expressed as means ± SEM (n = 5–8). *P < 0.05 compared with Con; #P < 0.05 compared with STZ. D: Immunoblots of NRF2, HO-1, AKR1C1, NQO1, and actin using mouse wound skin tissues (each lane contains wound skin tissue lysates from an individual mouse, n = 3 per group). E: IHC analysis of NRF2 and HO-1 using mouse wound skin tissues. Representative images from each group are shown (original magnification ×100).
Figure 3
Figure 3
Pharmacological NRF2 activation accelerates wound closure in STZ mice. Two wounds were made in the backs of mice (n = 5–8) as described in research design and methods. A: Representative photographs of wounds of mice in different groups at the indicated time points. B: Wound closure. All mice had two wounds made in their backs, and the wounds were photographed at the indicated time points before the skin tissues were harvested at day 14. The area of the two wounds was measured at the indicated time points to calculate wound closure (the percentage of wound that healed) at the indicated time points. Data were analyzed by ANOVA and Tukey post hoc test. Results are expressed as means ± SEM (n = 10–16). *P < 0.05 compared with Con; #P < 0.05 compared with STZ. C: Pathological assessment and diameter of mouse wound skin tissues 14 days after wound surgery. A representative image from one mouse per group is shown; the borders of the wound are indicated by dotted lines (original magnification ×40).
Figure 4
Figure 4
SF and CA modulate the expression of TGF-β1 and MMP9, alleviate oxidative DNA damage, and decrease apoptosis of skin tissues in STZ mice. A: Immunoblots of TGF-β1, MMP9, and actin using mouse wound skin tissue lysates. B: IHC analysis of wound skin tissues using the indicated antibodies, as well as apoptosis by TUNEL assay. A representative image from each group is shown (original magnification ×100). C: Infrared imaging of wound skin tissues. Representative photographs of wounds at the indicated days postsurgery (left) and quantification of temperature changes (Delta T) between wound area and surrounding healthy regions in the different treatment groups (right) are shown. Data were analyzed by ANOVA and Tukey post hoc test. Results are expressed as means ± SEM (n = 10–16). d, day. *P < 0.05 compared with Con; #P < 0.05 compared with STZ; ΔP < 0.05 compared with STZ+SF.
Figure 5
Figure 5
SF and CA activate the NRF2 pathway, modulate the expression of MMP9 and TGF-β1, and alleviate oxidative stress in human keratinocytes under hyperglycemic conditions. A and B: Immunoblots of NRF2, HO-1, AKR1C1, NQO1, and actin. HaCaT cells were incubated in either LG or HG medium for 2 days. HG cells were treated with 5 μmol/L SF or 20 μmol/L CA (HG+SF or HG+CA) for 48 h (A) or were transfected with the indicated siRNA (HG+Con-siRNA or HG+NRF2-siRNA) for 72 h (B). Cell lysates were subjected to immunoblot analysis. C–F: Immunoblots of MMP9 and zymography of secreted MMP9. HaCaT cells were incubated and treated as above; during the last 24 h HaCaT cells were switched from medium with 10% FBS to no FBS. C and D: Cells were harvested and subjected to immunoblot analysis. E and F: In another experiment, the medium was harvested to detect proteolytic activity of equal concentration of MMP9 by gelatin zymography. G and H: Immunoassay of TGF-β1 secreted to the medium. HaCaT cells were treated as above, and the medium was harvested to detect the extracellular TGF-β1 levels. The mean values were used and normalized to the LG (G) or LG+Con-siRNA (H) group, represented as bar graphs. Data were analyzed by ANOVA and Tukey post hoc test. Results are expressed as means ± SEM (n = 4). #P < 0.05 compared with HG or HG+Con-siRNA. I and J: ROS detection and quantification. Similarly treated HaCaT cells were subjected to DCF/flow cytometry analysis for ROS detection. The mean fluorescence values were used and normalized to the LG (I) or LG+Con-siRNA (J) group, represented as bar graphs. Data were analyzed by ANOVA and Tukey post hoc test. Results are expressed as means ± SEM (n = 3). *P < 0.05 compared with LG or LG+Con-siRNA; #P < 0.05 compared with HG or HG+Con-siRNA.
Figure 6
Figure 6
NRF2 activation promotes keratinocyte migration. A and B: In vitro wound healing assay of keratinocytes. HaCaT cells were incubated in either LG or HG medium for 2 days. Cells in HG were treated with 5 μmol/L SF or 20 μmol/L CA (HG+SF or HG+CA) for 24 h before removal of PDMS slab to generate gaps (A) or were transfected with the indicated siRNA (HG+Con-siRNA or HG+NRF2-siRNA) for 48 h, followed by removal of PDMS slab (B). Cells were incubated with fresh medium without or with SF or CA every day up to 72 h. Representative cell images from each group in the indicated time points after removal of PDMS slab are shown; the white dotted lines represent the wound boundary (left panels). Quantification of wound healing is shown (right panels). Data were analyzed by ANOVA and Tukey post hoc test. Results are expressed as means ± SEM (n = 4). *P < 0.05 compared with LG or LG+Con-siRNA group; #P < 0.05 compared with HG or HG+Con-siRNA.
Figure 7
Figure 7
NRF2 activation promotes keratinocyte proliferation and decreases apoptosis. A and B: Proliferation was assessed as cell growth index. Similarly treated (A) or siRNA-transfected (B) HaCaT cells were monitored for cell growth in real time. Data are expressed as means ± SEM (n = 3). C and D: Ki67 immunofluorescence images (top) and quantification of fluorescence intensity (bottom). Similarly treated (C) or siRNA-transfected (D) HaCaT cells were subjected to immunofluorescence analysis with Ki67 antibodies. The relative Ki67 expression was quantified and analyzed by ANOVA and Tukey post hoc test. Results are expressed as means ± SEM (n = 3). *P < 0.05 compared with LG or LG+Con-siRNA; #P < 0.05 compared with HG or HG+Con-siRNA. E and F: In situ cell death assessment by TUNEL assay (top) and quantification (bottom). Similarly treated (E) or siRNA-transfected (F) HaCaT cells were subjected to TUNEL analysis. For the positive control, cells were treated with 20 µmol/L cisplatin for 24 h. Relative cell apoptosis was quantified and analyzed by ANOVA and Tukey post hoc test. Results are expressed as means ± SEM (n = 3). *P < 0.05 compared with LG or LG+Con-siRNA; #P < 0.05 compared with HG or HG+Con-siRNA.

Comment in

References

    1. Boulton AJ, Vileikyte L, Ragnarson-Tennvall G, Apelqvist J. The global burden of diabetic foot disease. Lancet 2005;366:1719–1724 - PubMed
    1. Margolis DJ, Hoffstad O, Nafash J, et al. . Location, location, location: geographic clustering of lower-extremity amputation among Medicare beneficiaries with diabetes. Diabetes Care 2011;34:2363–2367 - PMC - PubMed
    1. Falanga V. Wound healing and its impairment in the diabetic foot. Lancet 2005;366:1736–1743 - PubMed
    1. Gurtner GC, Werner S, Barrandon Y, Longaker MT. Wound repair and regeneration. Nature 2008;453:314–321 - PubMed
    1. Martin P, Parkhurst SM. Parallels between tissue repair and embryo morphogenesis. Development 2004;131:3021–3034 - PubMed

Publication types

MeSH terms