

The higher level of complexity of K-Ras4B activation at the membrane
- PMID: 26718888
- PMCID: PMC4799498
- DOI: 10.1096/fj.15-279091
The higher level of complexity of K-Ras4B activation at the membrane
Erratum in
-
Correction.FASEB J. 2018 Sep;32(9):5209. doi: 10.1096/fj.15-279091ERR. FASEB J. 2018. PMID: 32077533 Free PMC article. No abstract available.
Abstract
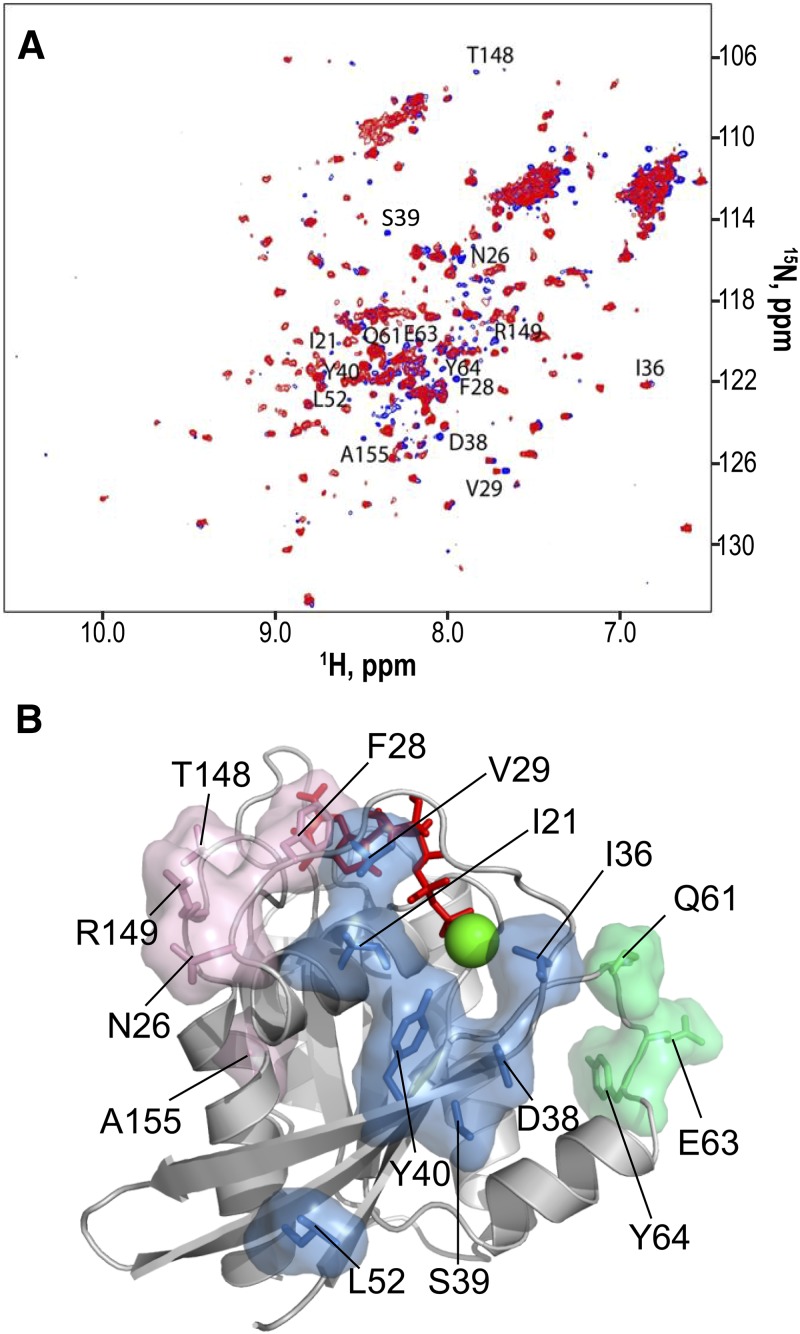
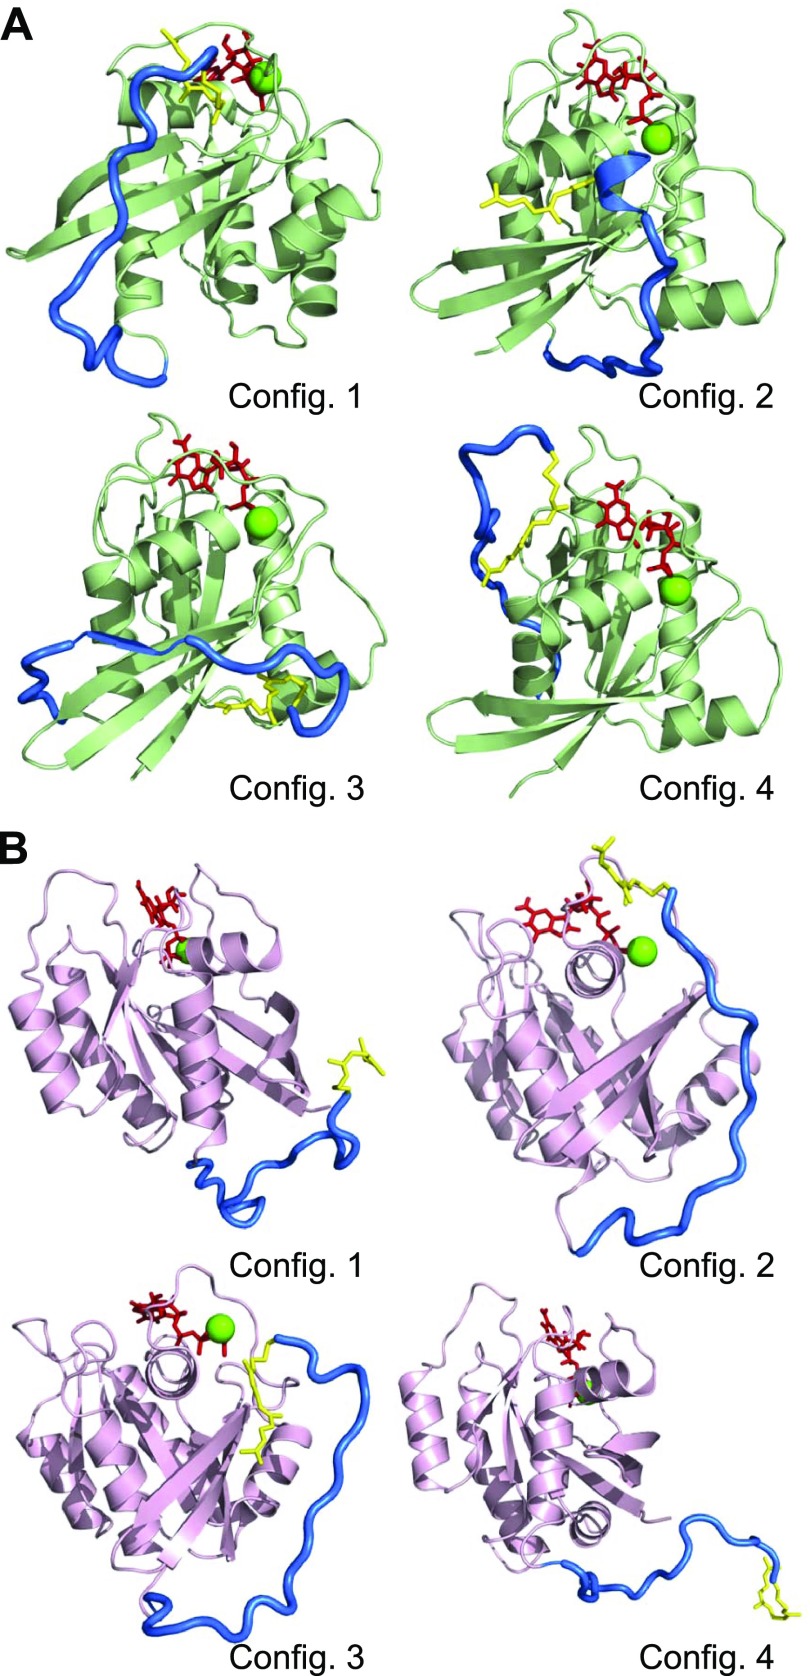
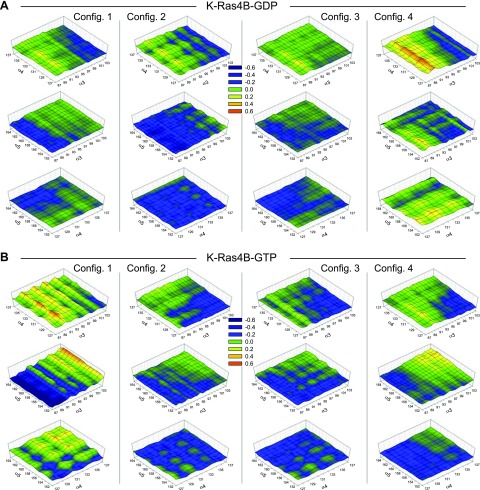
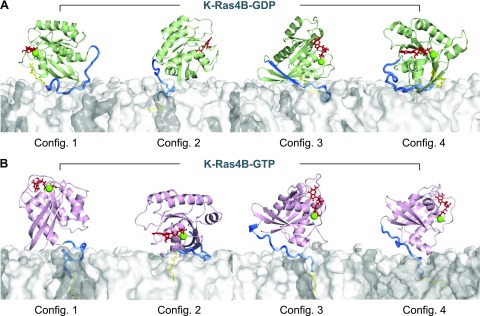
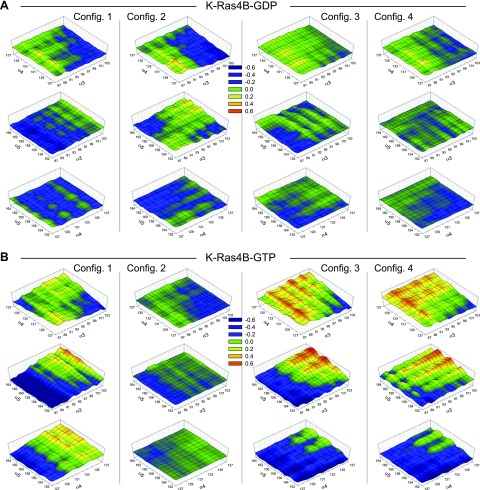
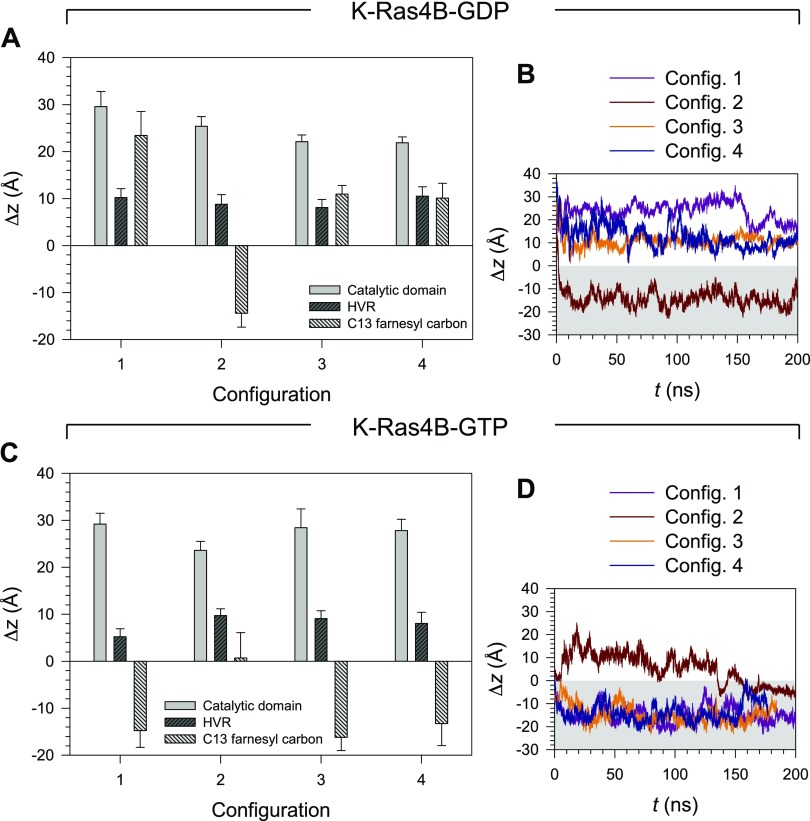
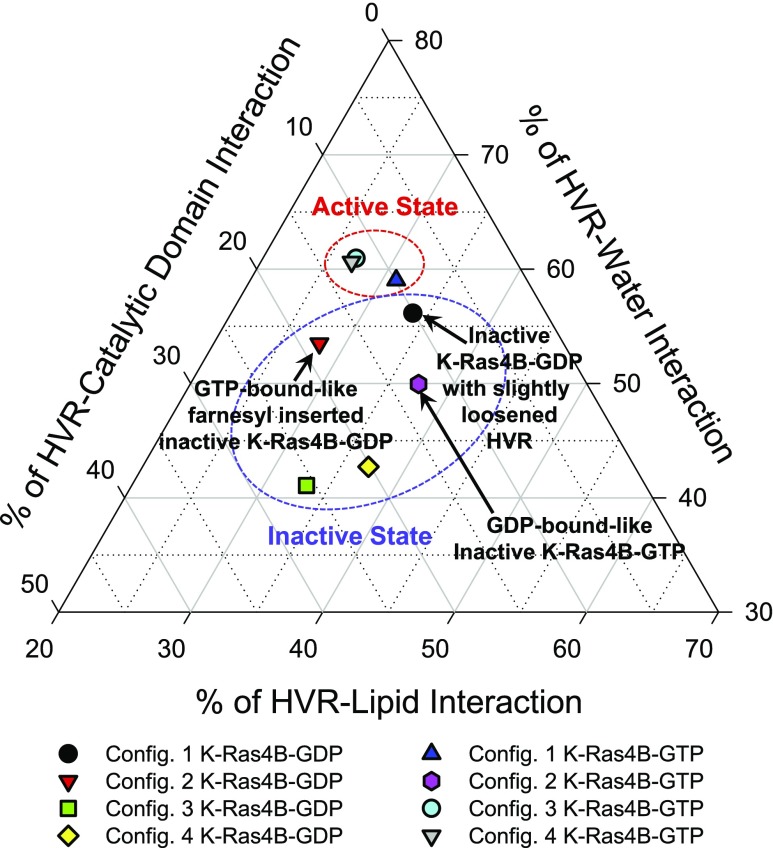
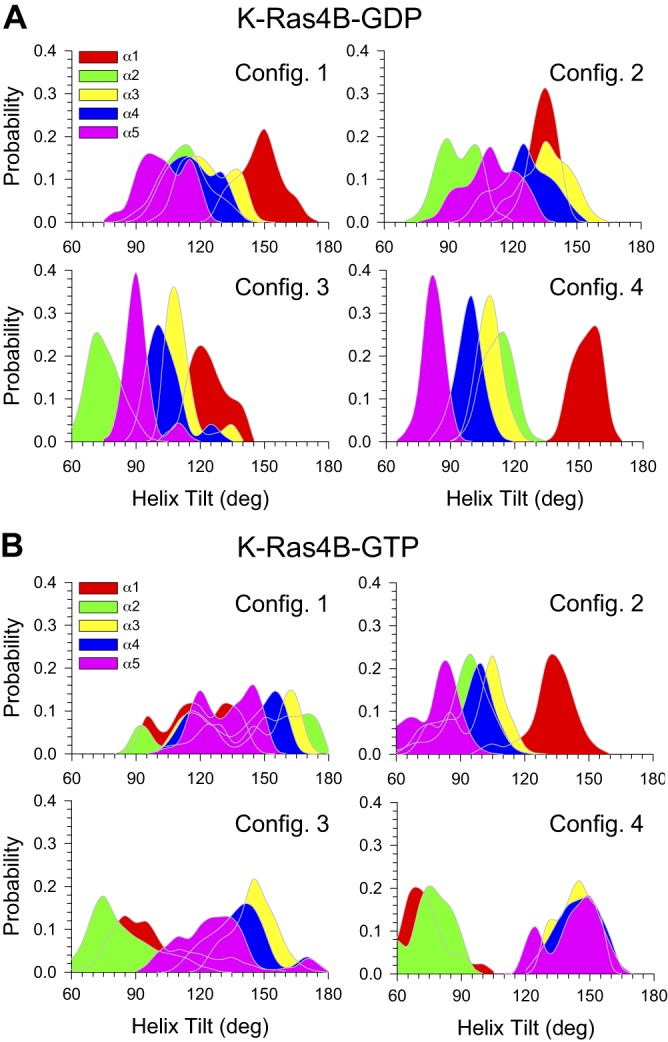
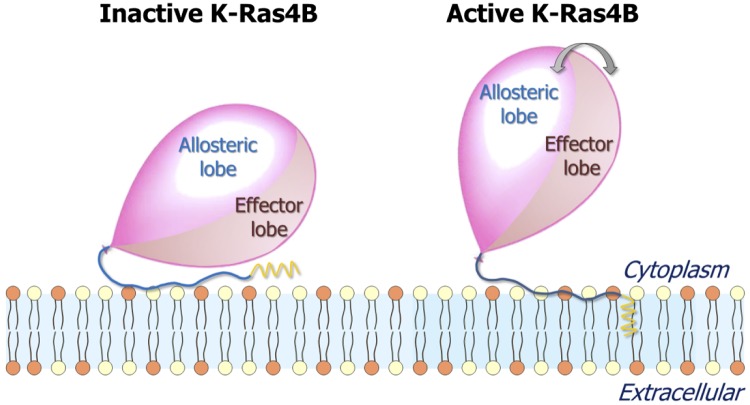
Is nucleotide exchange sufficient to activate K-Ras4B? To signal, oncogenic rat sarcoma (Ras) anchors in the membrane and recruits effectors by exposing its effector lobe. With the use of NMR and molecular dynamics (MD) simulations, we observed that in solution, farnesylated guanosine 5'-diphosphate (GDP)-bound K-Ras4B is predominantly autoinhibited by its hypervariable region (HVR), whereas the GTP-bound state favors an activated, HVR-released state. On the anionic membrane, the catalytic domain adopts multiple orientations, including parallel (∼180°) and perpendicular (∼90°) alignments of the allosteric helices, with respect to the membrane surface direction. In the autoinhibited state, the HVR is sandwiched between the effector lobe and the membrane; in the active state, with membrane-anchored farnesyl and unrestrained HVR, the catalytic domain fluctuates reinlessly, exposing its effector-binding site. Dimerization and clustering can reduce the fluctuations. This achieves preorganized, productive conformations. Notably, we also observe HVR-autoinhibited K-Ras4B-GTP states, with GDP-bound-like orientations of the helices. Thus, we propose that the GDP/GTP exchange may not be sufficient for activation; instead, our results suggest that the GDP/GTP exchange, HVR sequestration, farnesyl insertion, and orientation/localization of the catalytic domain at the membrane conjointly determine the active or inactive state of K-Ras4B. Importantly, K-Ras4B-GTP can exist in active and inactive states; on its own, GTP binding may not compel K-Ras4B activation.-Jang, H., Banerjee, A., Chavan, T. S, Lu, S., Zhang, J., Gaponenko, V., Nussinov, R. The higher level of complexity of K-Ras4B activation at the membrane.
Keywords: GDP/GTP exchange; KRAS; farnesyl insertion; phospholipids; signaling.
© FASEB.
Figures
Similar articles
-
GTP Binding and Oncogenic Mutations May Attenuate Hypervariable Region (HVR)-Catalytic Domain Interactions in Small GTPase K-Ras4B, Exposing the Effector Binding Site.J Biol Chem. 2015 Nov 27;290(48):28887-900. doi: 10.1074/jbc.M115.664755. Epub 2015 Oct 9. J Biol Chem. 2015. PMID: 26453300 Free PMC article.
-
The Structural Basis of Oncogenic Mutations G12, G13 and Q61 in Small GTPase K-Ras4B.Sci Rep. 2016 Feb 23;6:21949. doi: 10.1038/srep21949. Sci Rep. 2016. PMID: 26902995 Free PMC article.
-
Mechanisms of membrane binding of small GTPase K-Ras4B farnesylated hypervariable region.J Biol Chem. 2015 Apr 10;290(15):9465-77. doi: 10.1074/jbc.M114.620724. Epub 2015 Feb 24. J Biol Chem. 2015. PMID: 25713064 Free PMC article.
-
The disordered hypervariable region and the folded catalytic domain of oncogenic K-Ras4B partner in phospholipid binding.Curr Opin Struct Biol. 2016 Feb;36:10-7. doi: 10.1016/j.sbi.2015.11.010. Epub 2015 Dec 20. Curr Opin Struct Biol. 2016. PMID: 26709496 Free PMC article. Review.
-
The Hypervariable Region of K-Ras4B Governs Molecular Recognition and Function.Int J Mol Sci. 2019 Nov 14;20(22):5718. doi: 10.3390/ijms20225718. Int J Mol Sci. 2019. PMID: 31739603 Free PMC article. Review.
Cited by
-
Insight into structural dynamics involved in activation mechanism of full length KRAS wild type and P-loop mutants.Heliyon. 2024 Aug 13;10(16):e36161. doi: 10.1016/j.heliyon.2024.e36161. eCollection 2024 Aug 30. Heliyon. 2024. PMID: 39247361 Free PMC article.
-
Ras Multimers on the Membrane: Many Ways for a Heart-to-Heart Conversation.Genes (Basel). 2022 Jan 25;13(2):219. doi: 10.3390/genes13020219. Genes (Basel). 2022. PMID: 35205266 Free PMC article. Review.
-
Characterization of Lipid-Protein Interactions and Lipid-Mediated Modulation of Membrane Protein Function through Molecular Simulation.Chem Rev. 2019 May 8;119(9):6086-6161. doi: 10.1021/acs.chemrev.8b00608. Epub 2019 Apr 12. Chem Rev. 2019. PMID: 30978005 Free PMC article. Review.
-
The Ins and Outs of RAS Effector Complexes.Biomolecules. 2021 Feb 7;11(2):236. doi: 10.3390/biom11020236. Biomolecules. 2021. PMID: 33562401 Free PMC article. Review.
-
Oncogenic Ras Isoforms Signaling Specificity at the Membrane.Cancer Res. 2018 Feb 1;78(3):593-602. doi: 10.1158/0008-5472.CAN-17-2727. Epub 2017 Dec 22. Cancer Res. 2018. PMID: 29273632 Free PMC article. Review.
References
Publication types
MeSH terms
Substances
Grants and funding
LinkOut - more resources
Full Text Sources
Other Literature Sources
Miscellaneous
