. 2015 Dec 30;5(2):178-84.
doi: 10.1242/bio.016394.

Unique geometry of sister kinetochores in human oocytes during meiosis I may explain maternal age-associated increases in chromosomal abnormalities

Affiliations

Unique geometry of sister kinetochores in human oocytes during meiosis I may explain maternal age-associated increases in chromosomal abnormalities

Jessica Patel et al. Biol Open. .

Abstract

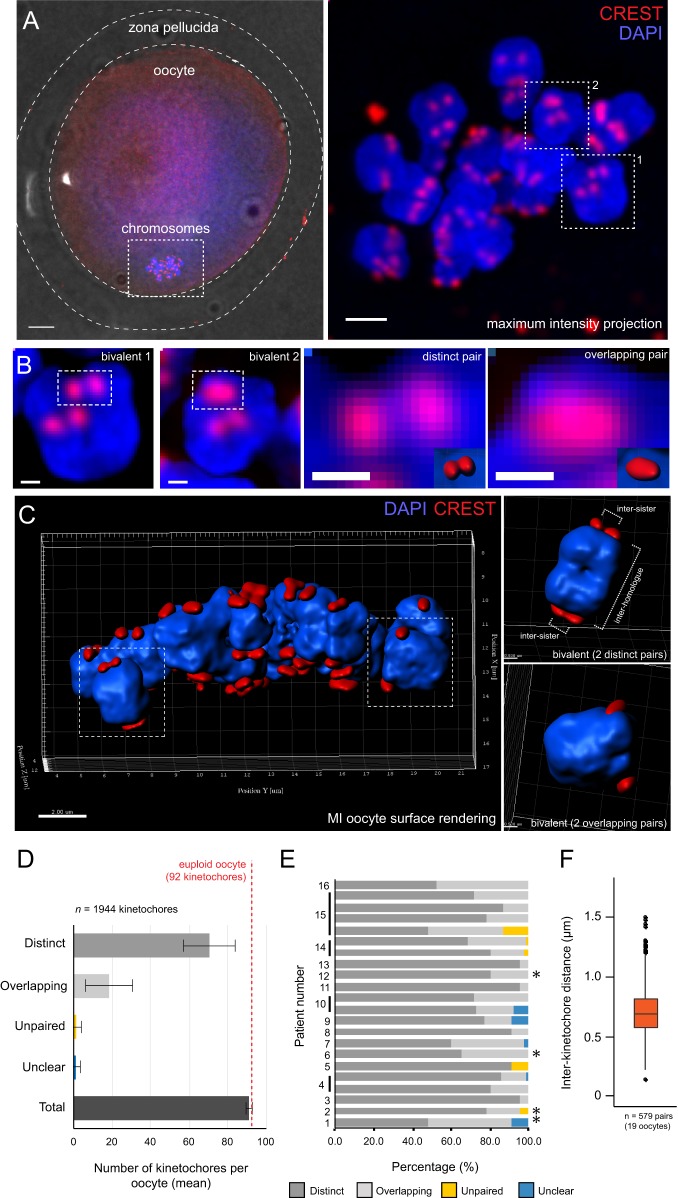
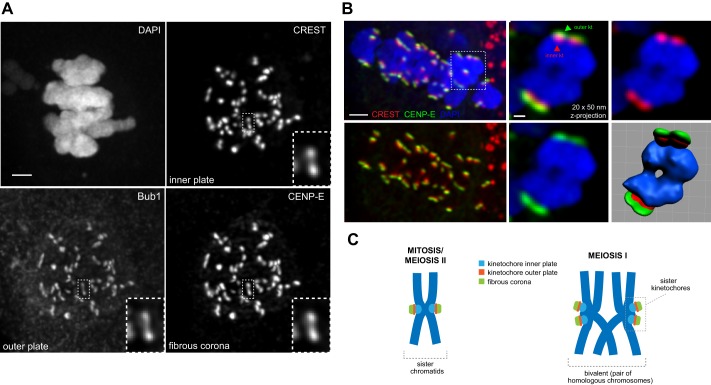
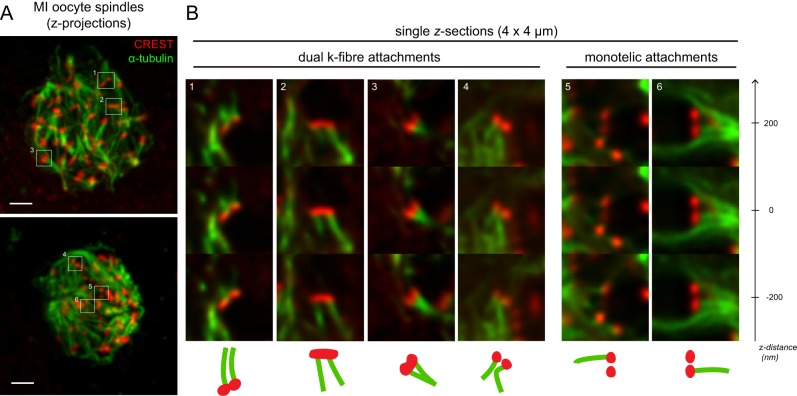
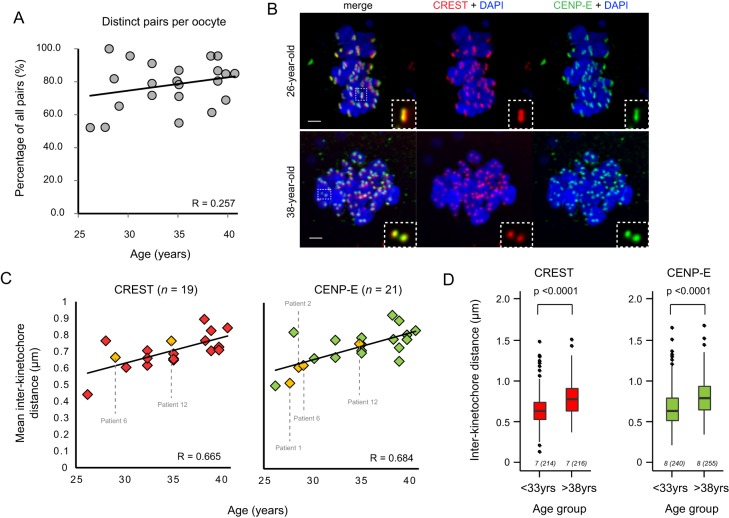
The first meiotic division in human oocytes is highly error-prone and contributes to the uniquely high incidence of aneuploidy observed in human pregnancies. A successful meiosis I (MI) division entails separation of homologous chromosome pairs and co-segregation of sister chromatids. For this to happen, sister kinetochores must form attachments to spindle kinetochore-fibres emanating from the same pole. In mouse and budding yeast, sister kinetochores remain closely associated with each other during MI, enabling them to act as a single unified structure. However, whether this arrangement also applies in human meiosis I oocytes was unclear. In this study, we perform high-resolution imaging of over 1900 kinetochores in human oocytes, to examine the geometry and architecture of the human meiotic kinetochore. We reveal that sister kinetochores in MI are not physically fused, and instead individual kinetochores within a pair are capable of forming independent attachments to spindle k-fibres. Notably, with increasing female age, the separation between kinetochores increases, suggesting a degradation of centromeric cohesion and/or changes in kinetochore architecture. Our data suggest that the differential arrangement of sister kinetochores and dual k-fibre attachments may explain the high proportion of unstable attachments that form in MI and thus indicate why human oocytes are prone to aneuploidy, particularly with increasing maternal age.

Keywords: Aneuploidy; Chromosome segregation; Human; Kinetochore; Meiosis; Oocyte.


Conflict of interest statement

Competing interests

The authors declare no competing or financial interests.

Figures

Fig. 1.
Fig. 1.
Sister kinetochores in meiosis I (MI) human oocytes are not fused. (A) Left panel: fixed human oocyte in MI. Dotted lines mark zona pellucida, oocyte and chromosomes (60× objective; scale bar=5 µm). Right panel: maximum intensity projection of the meiotic chromosomes within this same oocyte (100× objective; scale bar=2 µm). (B) Enlarged bivalents outlined in A, right panel, in which two kinetochore pairs per bivalent can be seen. Further enlargements of representative examples of distinct and overlapping sister kinetochore pairs are shown. Scale bars=0.5 µm. (C) 3D reconstruction of the kinetochores and chromosomes in an MI oocyte by surface rendering. To the right are two examples of individual bivalents showing the two categories of kinetochore pairs. (D) Mean±s.d. number of kinetochores within each oocyte, classified according to whether kinetochores were within distinct or overlapping pairs (n=1944 kinetochores from 22 oocytes). For a small number of kinetochores, sister kinetochores were so far apart (>1.5 µm) that they were classified as ‘unpaired’. A small number of foci could not be reliably identified as being either single kinetochores or overlapping pairs and these were classified as ‘unclear’. (E) Proportion of distinct and overlapping pairs for each individual oocyte. Asterisks indicate oocytes from women with no known fertility issues. (F) Inter-kinetochore distance as measured from the CREST signal (n=579 sister kinetochore pairs from 19 oocytes). Box plot represents interquartile range (IQR); whiskers extend to most extreme value within 1.5×IQR.
Fig. 2.
Fig. 2.
Inner/outer/corona regions of each sister kinetochore are distinct. (A) Chromosomes in a meiosis I (MI) oocyte stained with CREST antisera (kinetochore inner plate/centromere), anti-Bub1 antibodies (kinetochore outer plate) and anti-CENP-E antibodies (fibrous corona). Image is a maximum intensity projection incorporating 100×50 nm z-sections (5.0 µm). Inset shows a distinct sister kinetochore pair. Scale bar=2 µm. (B) Left upper and lower panels show a maximum intensity projection (100 × 50 nm z-sections) of chromosomes in an MI oocyte stained for CREST, CENP-E and DAPI. Lower-left panel shows the kinetochores only, in which CREST is clearly located towards the centromeric chromatin, with CENP-E on the outside. A projection (20 × 50 nm z-sections) of the outlined bivalent chromosome is shown in the middle and right panels, in which the arrangement of the inner (CREST, red) and outer (CENP-E, green) kinetochore can be seen more clearly. The bottom right panel depicts the surface rendered bivalent. Scale bars=2 µm (left panel), 0.5 µm (right panel). (C) Schematic showing the arrangement of sister kinetochores in mitosis (back-to-back) and the proposed arrangement in meiosis I (side-by-side).
Fig. 3.
Fig. 3.
Sister kinetochore pairs in meiosis I (MI) engage with independent kinetochore-fibres. (A) Two MI human oocyte spindles stained for microtubules (anti-α-tubulin) and kinetochores (CREST antisera) after cold-shock treatment. (B) Enlarged z-sections of the six different kinetochore pairs outlined by white boxes in A, with dual and monotelic attachments as indicated. Three z-sections from the stack are shown for each pair, at –200 nm, 0 nm and +200 nm. Scale bar=2 µm.
Fig. 4.
Fig. 4.
Inter-kinetochore distance between sister kinetochores in meiosis I increases with maternal age. (A) Relationship between proportion of distinct pairs per oocyte and female age (n=22 oocytes). (B) Comparison of oocyte chromosomes from a 26-year-old patient and a 38-year-old patient, showing increased inter-kinetochore distance with kinetochores marked with CREST antisera (red) and anti-CENP-E antibodies (green). Inset: representative example of a distinct kinetochore pair from each oocyte. Scale bars=2 µm. (C) Increasing inter-kinetochore distance with female age. Distance was measured in 3D from image stacks of kinetochore pairs, using CREST antisera (left plot) and anti-CENP-E antibodies (right plot) to mark the inner and outer regions of the kinetochores respectively. Patients with no known fertility problems (n=4) are marked in yellow. Patient numbers correspond to those shown in Table S1. R=linear correlation coefficient. (D) Comparison of inter-kinetochore distance between women under 33 years of age with women over 38 (P<0.0001, unpaired t-test) for CREST and CENP-E. Box plots represent interquartile range (IQR); whiskers extend to most extreme value within 1.5×IQR. The number of oocytes in each group is shown beneath each plot, with the total number of measurements in brackets.

References

    1. Chan G. K., Liu S.-T. and Yen T. J. (2005). Kinetochore structure and function. Trends Cell Biol. 15, 589-598. 10.1016/j.tcb.2005.09.010 - DOI - PubMed
    1. Chiang T., Duncan F. E., Schindler K., Schultz R. M. and Lampson M. A. (2010). Evidence that weakened centromere cohesion is a leading cause of age-related aneuploidy in oocytes. Curr. Biol. 20, 1522-1528. 10.1016/j.cub.2010.06.069 - DOI - PMC - PubMed
    1. Corbett K. D., Yip C. K., Ee L.-S., Walz T., Amon A. and Harrison S. C. (2010). The monopolin complex crosslinks kinetochore components to regulate chromosome-microtubule attachments. Cell 142, 556-567. 10.1016/j.cell.2010.07.017 - DOI - PMC - PubMed
    1. Duncan F. E., Hornick J. E., Lampson M. A., Schultz R. M., Shea L. D. and Woodruff T. K. (2012). Chromosome cohesion decreases in human eggs with advanced maternal age. Aging Cell 11, 1121-1124. 10.1111/j.1474-9726.2012.00866.x - DOI - PMC - PubMed
    1. Earnshaw W. C. (2015). Discovering centromere proteins: from cold white hands to the A, B, C of CENPs. Nat. Rev. Mol. Cell Biol. 16, 443-449. 10.1038/nrm4001 - DOI - PubMed