

Synaptic Amyloid-β Oligomers Precede p-Tau and Differentiate High Pathology Control Cases
- PMID: 26718979
- PMCID: PMC4715217
- DOI: 10.1016/j.ajpath.2015.09.018
Synaptic Amyloid-β Oligomers Precede p-Tau and Differentiate High Pathology Control Cases
Abstract
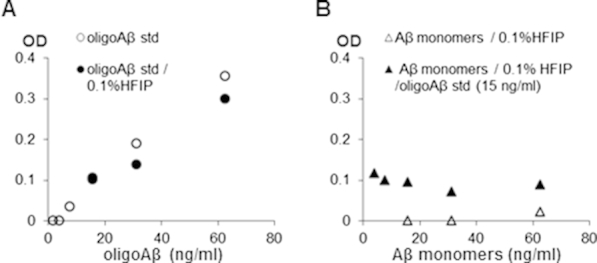
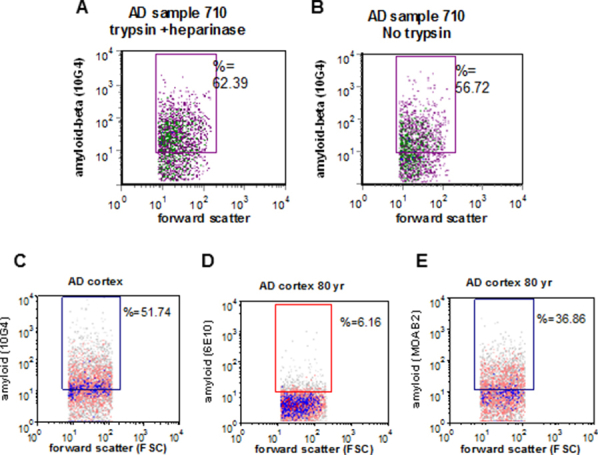
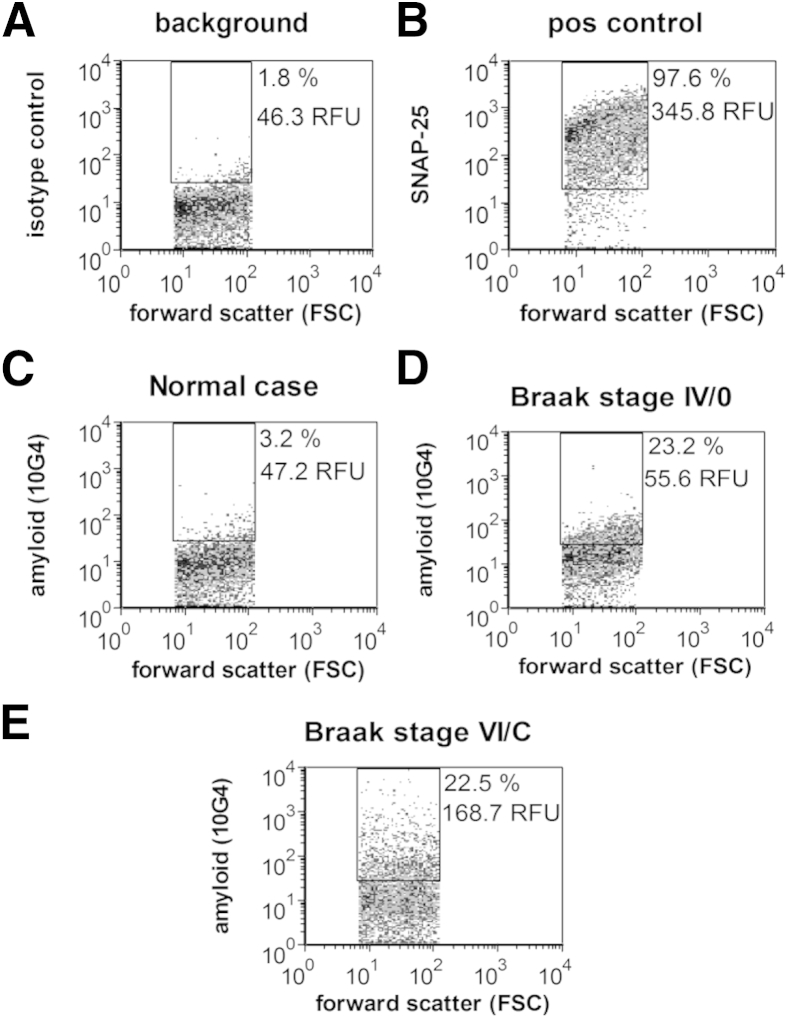
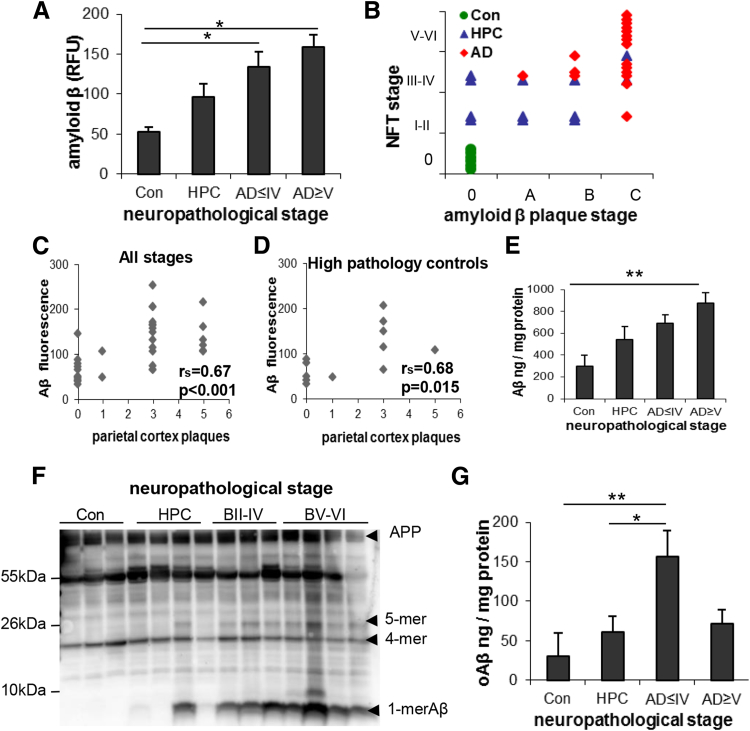
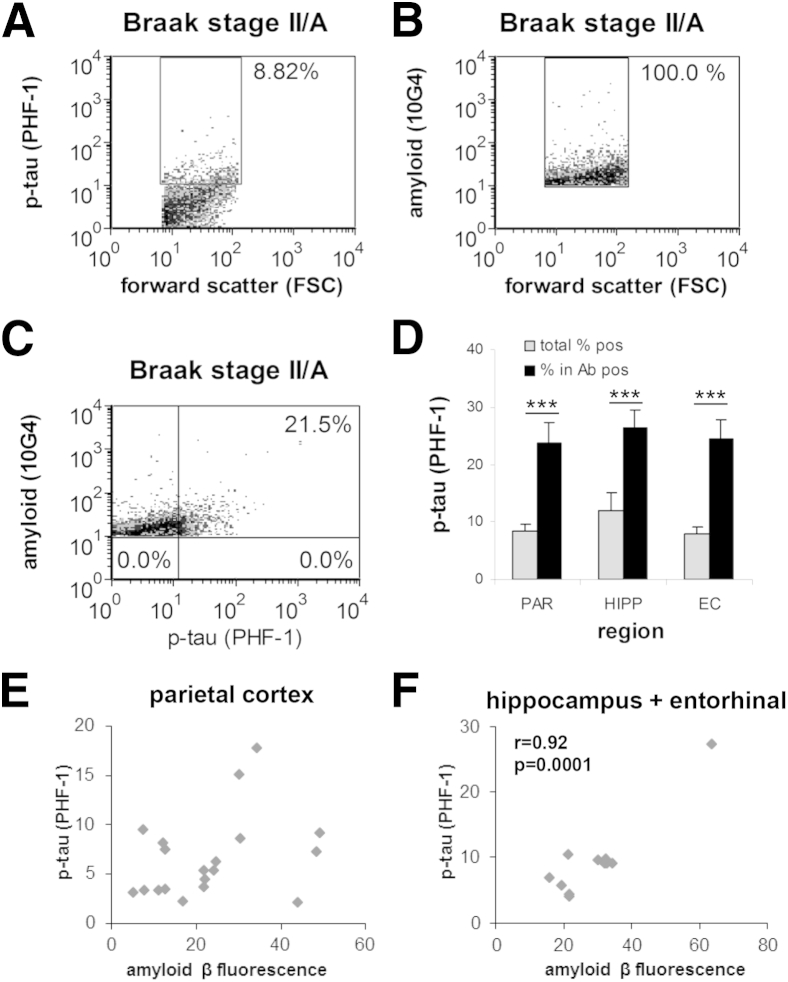
Amyloid-β (Aβ) and hyperphosphorylated tau (p-tau) aggregates form the two discrete pathologies of Alzheimer disease (AD), and oligomeric assemblies of each protein are localized to synapses. To determine the sequence by which pathology appears in synapses, Aβ and p-tau were quantified across AD disease stages in parietal cortex. Nondemented cases with high levels of AD-related pathology were included to determine factors that confer protection from clinical symptoms. Flow cytometric analysis of synaptosome preparations was used to quantify Aβ and p-tau in large populations of individual synaptic terminals. Soluble Aβ oligomers were assayed by a single antibody sandwich enzyme-linked immunosorbent assay. Total in situ Aβ was elevated in patients with early- and late-stage AD dementia, but not in high pathology nondemented controls compared with age-matched normal controls. However, soluble Aβ oligomers were highest in early AD synapses, and this assay distinguished early AD cases from high pathology controls. Overall, synapse-associated p-tau did not increase until late-stage disease in human and transgenic rat cortex, and p-tau was elevated in individual Aβ-positive synaptosomes in early AD. These results suggest that soluble oligomers in surviving neocortical synaptic terminals are associated with dementia onset and suggest an amyloid cascade hypothesis in which oligomeric Aβ drives phosphorylated tau accumulation and synaptic spread. These results indicate that antiamyloid therapies will be less effective once p-tau pathology is developed.
Copyright © 2016 American Society for Investigative Pathology. Published by Elsevier Inc. All rights reserved.
Figures
Similar articles
-
Amyloid-β oligomers increase the binding and internalization of tau oligomers in human synapses.Acta Neuropathol. 2024 Dec 17;149(1):2. doi: 10.1007/s00401-024-02839-2. Acta Neuropathol. 2024. PMID: 39688618 Free PMC article.
-
Isolation of synaptic terminals from Alzheimer's disease cortex.Cytometry A. 2012 Mar;81(3):248-54. doi: 10.1002/cyto.a.22009. Epub 2011 Dec 28. Cytometry A. 2012. PMID: 22213704 Free PMC article.
-
Extensive p-tau pathology and SDS-stable p-tau oligomers in Alzheimer's cortical synapses.Brain Pathol. 2012 Nov;22(6):826-33. doi: 10.1111/j.1750-3639.2012.00598.x. Epub 2012 May 23. Brain Pathol. 2012. PMID: 22486774 Free PMC article.
-
The inside-out amyloid hypothesis and synapse pathology in Alzheimer's disease.Neurodegener Dis. 2014;13(2-3):142-6. doi: 10.1159/000354776. Epub 2013 Sep 24. Neurodegener Dis. 2014. PMID: 24080821 Review.
-
Alzheimer's disease.Subcell Biochem. 2012;65:329-52. doi: 10.1007/978-94-007-5416-4_14. Subcell Biochem. 2012. PMID: 23225010 Review.
Cited by
-
Potential Mechanisms Underlying Resistance to Dementia in Non-Demented Individuals with Alzheimer's Disease Neuropathology.J Alzheimers Dis. 2022;87(1):51-81. doi: 10.3233/JAD-210607. J Alzheimers Dis. 2022. PMID: 35275527 Free PMC article. Review.
-
Lipoprotein Metabolism, Protein Aggregation, and Alzheimer's Disease: A Literature Review.Int J Mol Sci. 2023 Feb 2;24(3):2944. doi: 10.3390/ijms24032944. Int J Mol Sci. 2023. PMID: 36769268 Free PMC article. Review.
-
Mass synaptometry: High-dimensional multi parametric assay for single synapses.J Neurosci Methods. 2019 Jan 15;312:73-83. doi: 10.1016/j.jneumeth.2018.11.008. Epub 2018 Nov 20. J Neurosci Methods. 2019. PMID: 30465796 Free PMC article.
-
The Study of Postmortem Human Synaptosomes for Understanding Alzheimer's Disease and Other Neurological Disorders: A Review.Neurol Ther. 2017 Jul;6(Suppl 1):57-68. doi: 10.1007/s40120-017-0070-z. Epub 2017 Jul 21. Neurol Ther. 2017. PMID: 28733958 Free PMC article. Review.
-
microRNAs as Early Biomarkers of Alzheimer's Disease: A Synaptic Perspective.Cells. 2021 Jan 9;10(1):113. doi: 10.3390/cells10010113. Cells. 2021. PMID: 33435363 Free PMC article. Review.
References
-
- Hefti F., Goure W.F., Jerecic J., Iverson K.S., Walicke P.A., Krafft G.A. The case for soluble Abeta oligomers as a drug target in Alzheimer's disease. Trends Pharmacol Sci. 2013;34:261–266. - PubMed
-
- Arriagada P.V., Growdon J.H., Hedley-Whyte E.T., Hyman B.T. Neurofibrillary tangles but not senile plaques parallel duration and severity of Alzheimer's disease. Neurology. 1992;42:631–639. - PubMed
-
- Bierer L.M., Hof P.R., Purohit D.P., Carlin L., Schmeidler J., Davis K.L., Perl D.P. Neocortical neurofibrillary tangles correlate with dementia severity in Alzheimer's disease. Arch Neurol. 1995;52:81–88. - PubMed
-
- Giannakopoulos P., Herrmann F.R., Bussiere T., Bouras C., Kovari E., Perl D.P., Morrison J.H., Gold G., Hof P.R. Tangle and neuron numbers, but not amyloid load, predict cognitive status in Alzheimer's disease. Neurology. 2003;60:1495–1500. - PubMed
Publication types
MeSH terms
Substances
Grants and funding
- R01 AG018879/AG/NIA NIH HHS/United States
- P50 AG16970/AG/NIA NIH HHS/United States
- AG34628/AG/NIA NIH HHS/United States
- R56 AG027465/AG/NIA NIH HHS/United States
- R01 AG041295/AG/NIA NIH HHS/United States
- UL1 TR000124/TR/NCATS NIH HHS/United States
- AG18879/AG/NIA NIH HHS/United States
- R21 AG051946/AG/NIA NIH HHS/United States
- CA16042/CA/NCI NIH HHS/United States
- R01 AG027465/AG/NIA NIH HHS/United States
- K08 AG034628/AG/NIA NIH HHS/United States
- R01 NS038328/NS/NINDS NIH HHS/United States
- P50 AG016573/AG/NIA NIH HHS/United States
- P50 AG005142/AG/NIA NIH HHS/United States
- NS038328/NS/NINDS NIH HHS/United States
- P30 CA016042/CA/NCI NIH HHS/United States
- P50 AG05142/AG/NIA NIH HHS/United States
- AI 28697/AI/NIAID NIH HHS/United States
- R01AG21055/AG/NIA NIH HHS/United States
- UL1TR000124/TR/NCATS NIH HHS/United States
- AG041295/AG/NIA NIH HHS/United States
- AG27465/AG/NIA NIH HHS/United States
- P50 AG16573/AG/NIA NIH HHS/United States
- P30 AI028697/AI/NIAID NIH HHS/United States
- R01 AG021055/AG/NIA NIH HHS/United States
- P01 AG000538/AG/NIA NIH HHS/United States
- P30 AG028748/AG/NIA NIH HHS/United States
LinkOut - more resources
Full Text Sources
Other Literature Sources
Medical
