. 2015 Dec 30;90(6):2767-82.
doi: 10.1128/JVI.02949-15.

Alpha-Synuclein Expression Restricts RNA Viral Infections in the Brain

Affiliations

Alpha-Synuclein Expression Restricts RNA Viral Infections in the Brain

Erica L Beatman et al. J Virol. .

Abstract

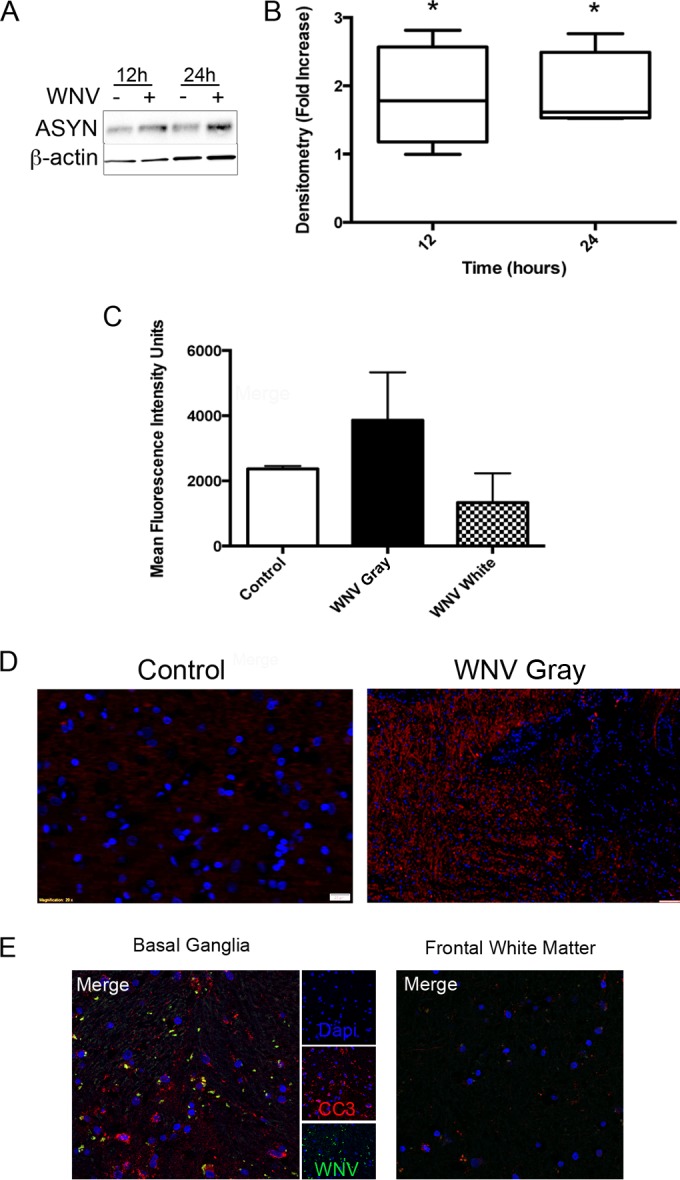
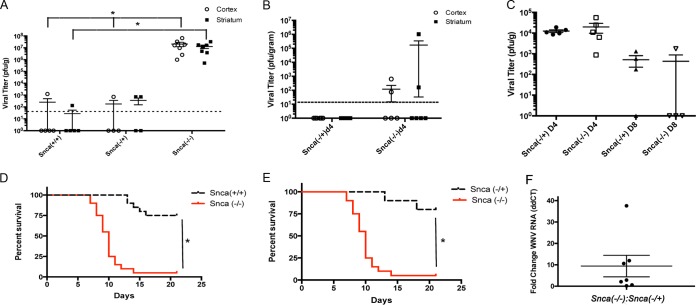
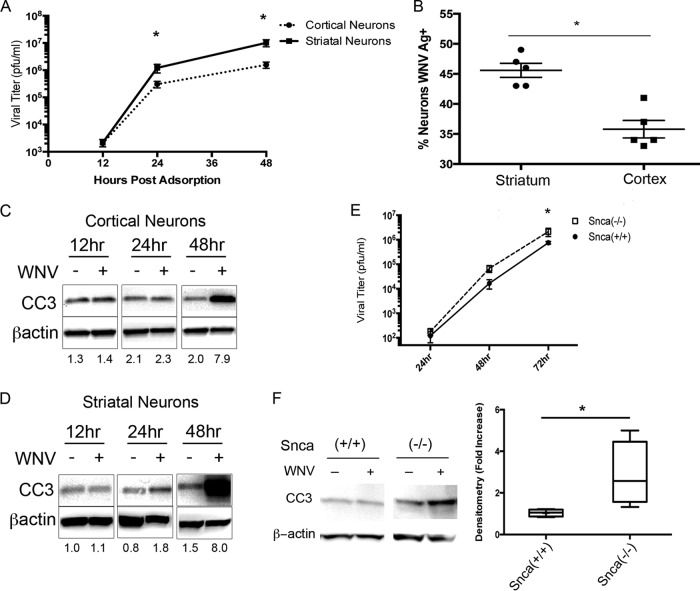
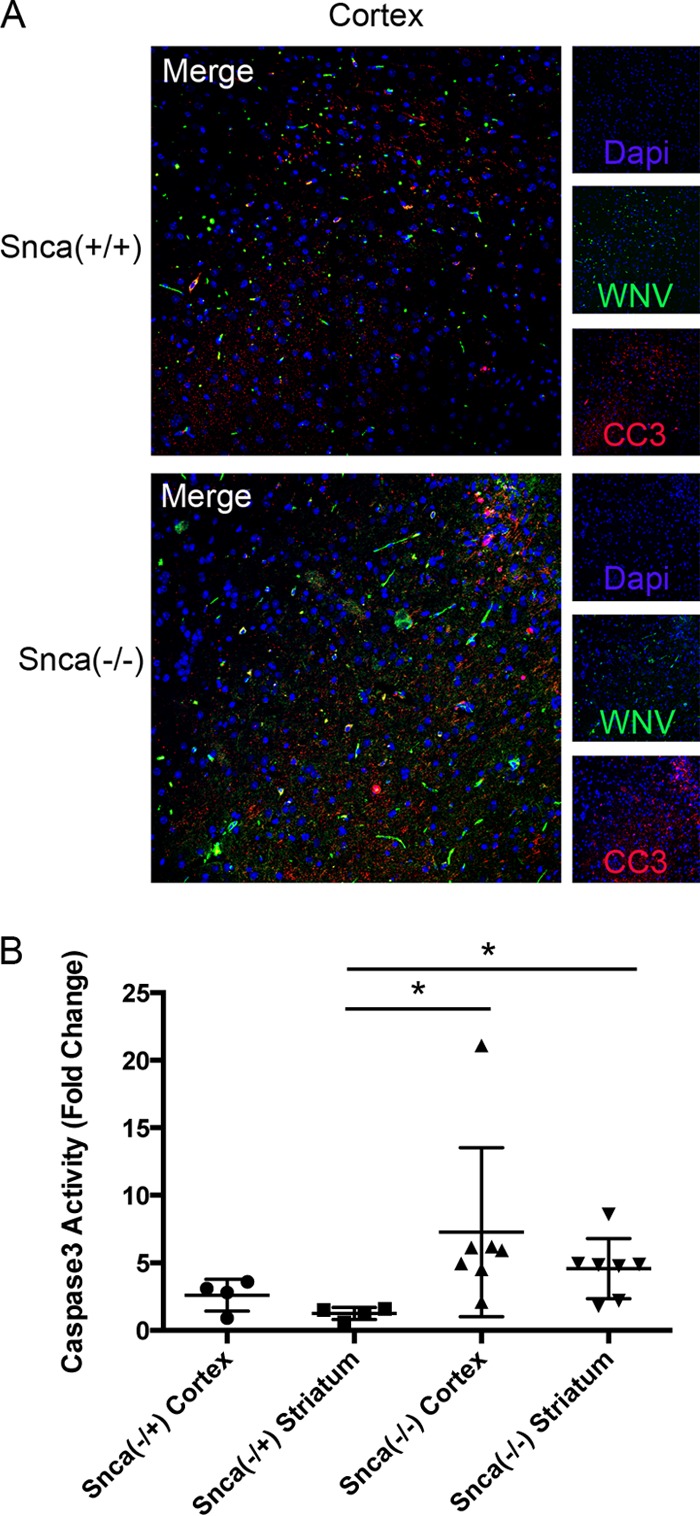
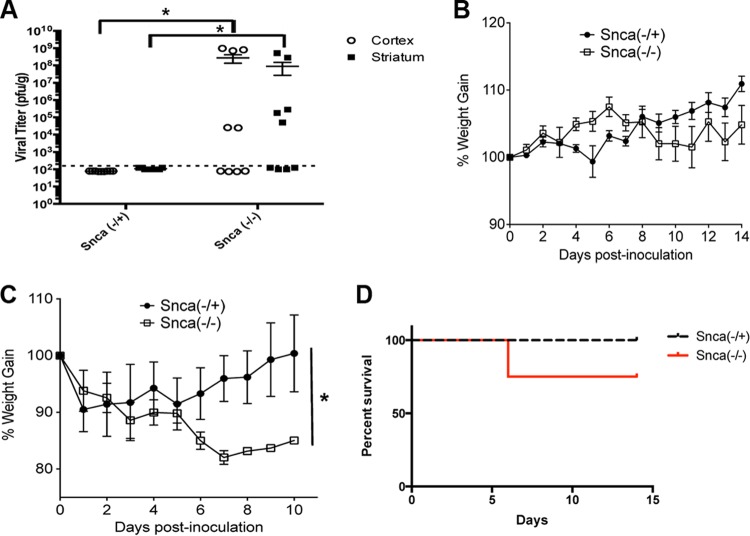
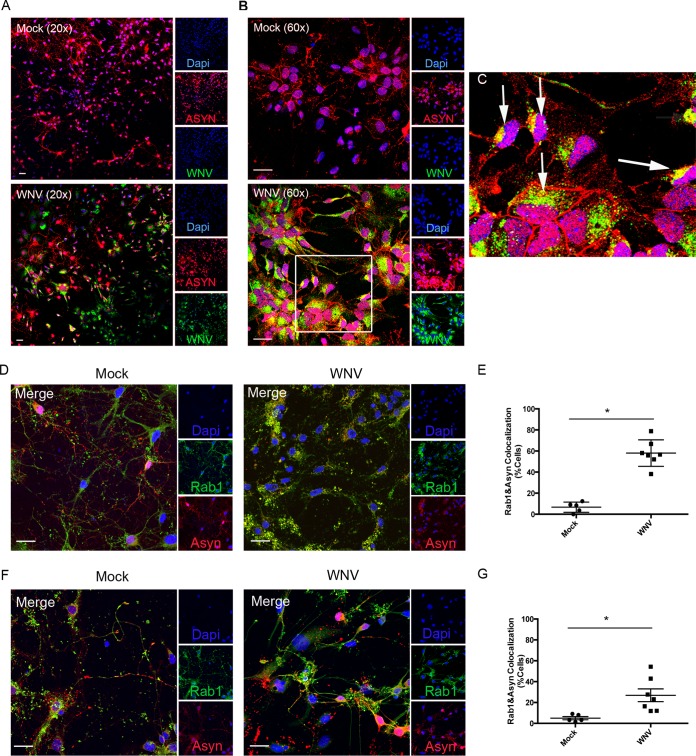
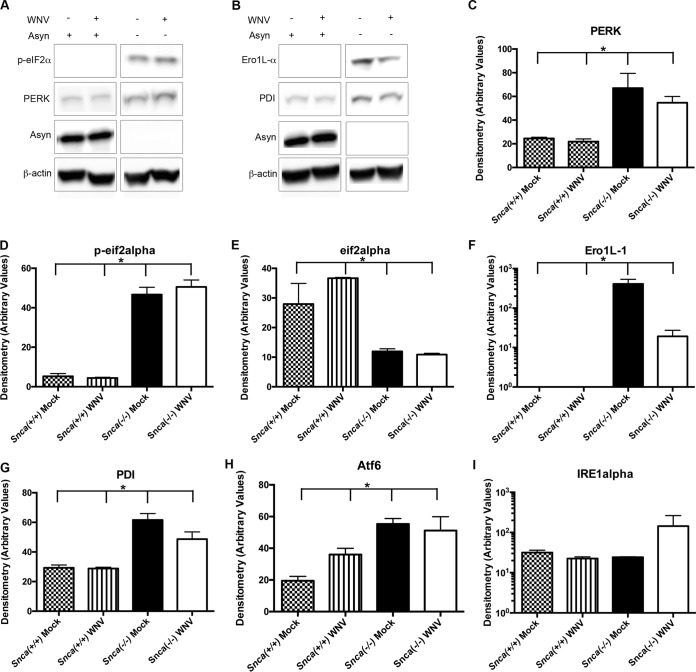
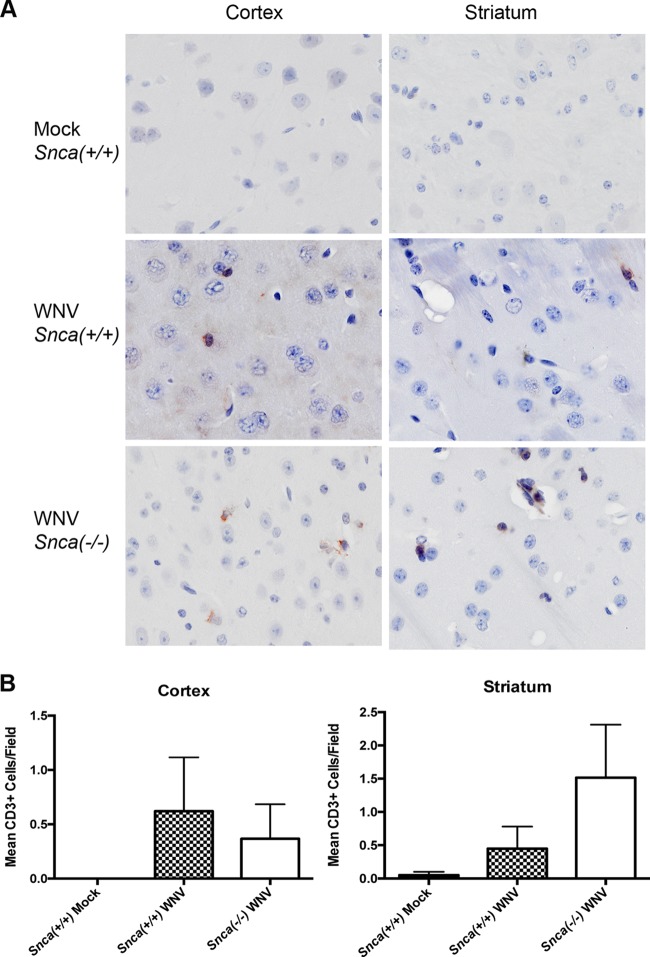
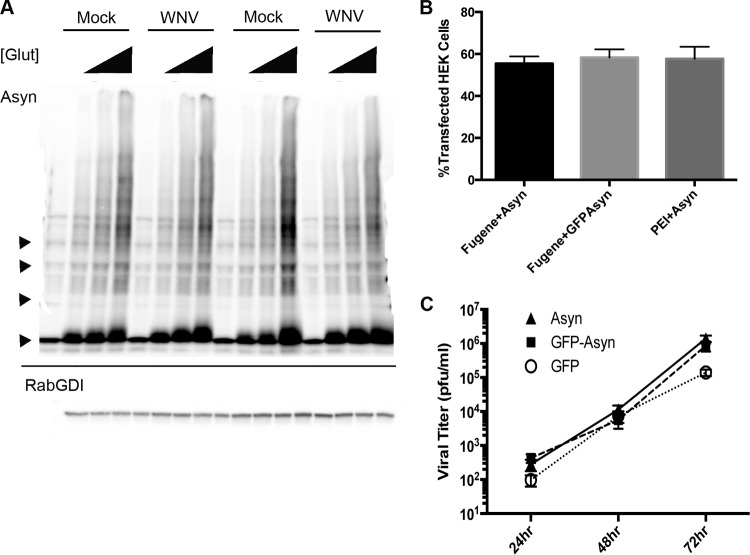
We have discovered that native, neuronal expression of alpha-synuclein (Asyn) inhibits viral infection, injury, and disease in the central nervous system (CNS). Enveloped RNA viruses, such as West Nile virus (WNV), invade the CNS and cause encephalitis, yet little is known about the innate neuron-specific inhibitors of viral infections in the CNS. Following WNV infection of primary neurons, we found that Asyn protein expression is increased. The infectious titer of WNV and Venezuelan equine encephalitis virus (VEEV) TC83 in the brains of Asyn-knockout mice exhibited a mean increase of 10(4.5) infectious viral particles compared to the titers in wild-type and heterozygote littermates. Asyn-knockout mice also exhibited significantly increased virus-induced mortality compared to Asyn heterozygote or homozygote control mice. Virus-induced Asyn localized to perinuclear, neuronal regions expressing viral envelope protein and the endoplasmic reticulum (ER)-associated trafficking protein Rab1. In Asyn-knockout primary neuronal cultures, the levels of expression of ER signaling pathways, known to support WNV replication, were significantly elevated before and during viral infection compared to those in Asyn-expressing primary neuronal cultures. We propose a model in which virus-induced Asyn localizes to ER-derived membranes, modulates virus-induced ER stress signaling, and inhibits viral replication, growth, and injury in the CNS. These data provide a novel and important functional role for the expression of native alpha-synuclein, a protein that is closely associated with the development of Parkinson's disease.

Importance: Neuroinvasive viruses such as West Nile virus are able to infect neurons and cause severe disease, such as encephalitis, or infection of brain tissue. Following viral infection in the central nervous system, only select neurons are infected, implying that neurons exhibit innate resistance to viral infections. We discovered that native neuronal expression of alpha-synuclein inhibited viral infection in the central nervous system. When the gene for alpha-synuclein was deleted, mice exhibited significantly decreased survival, markedly increased viral growth in the brain, and evidence of increased neuron injury. Virus-induced alpha-synuclein localized to intracellular neuron membranes, and in the absence of alpha-synuclein expression, specific endoplasmic reticulum stress signaling events were significantly increased. We describe a new neuron-specific inhibitor of viral infections in the central nervous system. Given the importance of alpha-synuclein as a cause of Parkinson's disease, these data also ascribe a novel functional role for the native expression of alpha-synuclein in the CNS.


Figures

FIG 1
FIG 1
West Nile virus infection increases alpha-synuclein expression. (A) Western blot analysis of WNV-inoculated primary striatal neurons using antibody to Asyn at the indicated time points. (B) Densitometry analysis from Western blots for Asyn using primary striatal neurons from WNV-inoculated Snca+/+ mice in three replicate experiments. Data are shown as the mean ± SEM fold increase in band density compared to that for the mock-inoculated control and corrected for β-actin loading. *, P = 0.086, nonparametric ANOVA. (C) Mean fluorescence intensity units of immunolabeled Asyn expression in brain tissue from uninfected control patients and tissue from patients with WNV encephalitis. Samples from subcortical gray matter (WNV Gray) and white matter regions (WNV white) were also included. Error bars represent the SEMs of the means obtained from the patients listed in Table 1. (D) Asyn expression (Cy3, red) in formalin-fixed, paraffin-embedded sections from autopsy brain tissue consisting of basal ganglia (WNV Gray) from a patient with WNV encephalitis and basal ganglia from an uninfected patient (Control). Magnification, ×200; bar = 50 μm. (E) Laser confocal images from IF analysis of human brain tissue infected with WNV showing the distribution and colocalization of WNV envelope antigen (FITC, green) and CC3 (Cy3, red). Magnifications, ×400.
FIG 2
FIG 2
Alpha-synuclein expression inhibits WNV growth and disease in the CNS. (A) Viral titers in striatal and cortical brain tissue from WNV-inoculated (NY99, 103 PFU s.c.) mice in the indicated groups and brain sections at day 8 postinoculation. Dotted line, limit of detection. *, P = 0.0001. Each data point represents an individual. (B) Viral titers in striatal and cortical brain tissue from WNV-inoculated (NY99, 103 PFU s.c.) mice in the indicated groups at day 4 (d4) postinoculation. Dotted line, limit of detection. (C) Spleens from Snca−/+ and Snca−/− mice that were sacrificed at day 4 (D4) and day 8 (D8) postinoculation were analyzed for the infectious viral titer. No significant difference in the spleen viral titer was detected between the groups. (D and E) Survival analysis following WNV inoculation (103 PFU s.c.) of Snca−/− mice and comparison of survival of Snca−/− mice to that of Snca+/+ mice (D) and Snca−/+ mice (E). *, P < 0.0001. Data for the same group of Snca−/− mice (n = 20) are represented in both panels D and E and were individually compared to those for Snca+/+ (n = 20) and Snca−/+ (n = 10) mice. (F) Fold change in WNV RNA replication, determined using qRT-PCR, in striatal brain tissue from WNV-infected Snca−/− mice compared to that in striatal brain tissue from Snca−/+ mice. RNA isolated from the same groups was used for the viral titer assays at day 8 postinfection. The mean fold increase was 9.4 ± 5.02 (SEM). ddCT, ΔΔCT, where CT represents the threshold cycle.
FIG 3
FIG 3
Alpha-synuclein expression modulates WNV-induced caspase-3 activation in primary cortical neurons. (A) Primary mouse cortical and striatal neuron cultures were inoculated with WNV (MOI, 1), and the infectious viral titer in the supernatant was determined at the indicated time points postinoculation. *, P = 0.0045. (B) Primary neurons were made from the striatal and cortical tissues, inoculated with WNV (MOI, 1), and harvested at 24 h postinoculation for determination of WNV infectivity using immunocytochemistry and cell counts for cells double positive for the WNV envelope antigen (Ag+) and DARP32 (a striatal neuron marker) or Emx1 (a cortical neuron marker). *, P = 0.009. (C and D) Representative images of Western blots of whole-cell lysates probed for CC3 from WNV-inoculated (MOI, 1) primary cortical neurons (C) and primary striatal neurons (D) harvested at the indicated times postinoculation. The values for densitometry below each band are the mean values from three independent experiments. (E) WNV infectious titer in supernatants from Snca+/+ and Snca−/− primary cortical neurons assayed at the indicated time points postinoculation with WNV (MOI, 0.001). Data are for 5 experimental replicates per treatment group. *, P < 0.05, two-way ANOVA with multiple comparisons. (F) (Left) Representative Western blot analysis for CC3 in primary cortical neurons from Snca+/+ and Snca−/− mice performed at 24 h postinoculation with WNV (MOI, 1). (Right) Densitometry analysis from Western blots for CC3 performed at 24 h postinfection. Data are the mean ± SEM fold increase from three replicate experiments with WNV-inoculated primary cortical neurons from Snca−/− mice (2.6 ± 0.8) and wild-type mice (1.05 ± 0.08). The data are shown as the mean fold increase in density compared to that for the mock-inoculated control and were corrected for β-actin loading. *, P = 0.03.
FIG 4
FIG 4
Asyn expression prevents WNV-induced caspase-3 activation in the brain. (A) Representative IFA image of cortical brain tissue from WNV-inoculated Snca+/+ and Snca−/− mice at day 8 postinoculation. Brain tissue was immunolabeled with antibodies to the WNV envelope (FITC, green) and cleaved caspase-3 (Cy3, red). Images representative of those from 6 replicates are shown. Dapi, 4′,6-diamidino-2-phenylindole. Magnification, ×600. (B) Caspase-3 activity assay values obtained from individual mice and for the indicated brain regions of the indicated groups at day 8 postinoculation with WNV (NY99, 103 PFU s.c.). Values are expressed as the fold change compared to the value for mock-inoculated control animals in the same groups harvested in parallel. *, P = 0.007. The mean ± SEM fold increases in CC3 activity for the Snca−/+ mouse cortex (2.6 ± 0.59), the Snca−/+ mouse striatum (1.25 ± 0.23), the Snca−/− mouse cortex (7.3 ± 2.4), and the Snca−/− mouse striatum (4.6 ± 0.84) found at day 8 postinfection with WNV are provided.
FIG 5
FIG 5
Alpha-synuclein expression inhibits VEEV TC83 growth in the CNS. (A) Infectious viral titers in striatal and cortical brain tissue from VEEV TC83-inoculated (107 PFU s.c.) mice in the indicated groups at day 7 postinoculation. Dotted line, limit of detection. *, P = 0.03. (B) Mean percent weight change over time in VEEV TC83-inoculated (107 PFU s.c.) mice in the indicated groups (n = 11). (C) Mean percent weight change over time in VEEV TC83-inoculated (103 PFU, i.c. injection) mice in the indicated groups. *, P = 0.04 (n = 4 per group). (D) Percent survival over time of VEEV TC83-inoculated (103 PFU i.c.) mice in the indicated groups (n = 4 per group).
FIG 6
FIG 6
Alpha-synuclein localizes with the WNV envelope antigen and Rab1-positive membranes. (A and B) IFA images of mock and WNV-inoculated (MOI, 1) primary striatal neurons obtained using antibodies to the WNV envelope (FITC, green) and alpha-synuclein (Cy3, red). Bars = 25 μm. The data are representative of those from three replicate experiments. (C) Digitally magnified image of the boxed area in panel B showing the subcellular localization of Asyn (Cy3, red) and the WNV envelope (FITC, green) antigen. Magnification, ×1,000. Arrows, red-green colocalization in the perinuclear regions of infected neurons. (D to G) Primary cortical neurons (D and E) and primary striatal neurons (F and G) from Snca+/+ mice following mock or WNV inoculation (MOI, 1). Neurons were harvested at 24 h postinoculation for IFA of the indicated proteins. Quantification of the percentage of primary cortical neurons (*, P < 0.0001) (E) and primary striatal neurons (*, P = 0.01) (G) exhibiting Asyn-Rab1 colocalization following mock or WNV inoculation, as described above. Data are for three experimental replicates per group. Each dot represents the mean of individual values from the three experiments. Bars = 25 μm.
FIG 7
FIG 7
Asyn expression modulates ER stress signaling. Primary cortical neurons derived from Snca+/+ and Snca−/− mice were mock inoculated or inoculated with WNV (MOI, 1) and harvested at 24 h for Western blot analysis of whole-cell lysates for ER stress signaling proteins. (A) Representative image of a Western blot probed with antibodies to phosphorylated eIF2alpha (p-eIF2alpha), PERK, Asyn, and β-actin. (B) Representative image of a Western blot probed with antibodies to Ero1L-1α, PDI, Asyn, and β-actin. Data are for three experimental replicates. (C to I) Semiquantitative densitometry analysis of mean band density corrected for by the density of β-actin for PERK (*, P = 0.006) (C), phospho-eIF2α (p-eIF2α; *, P = 0.011) (D), total eIF2α (*, P = 0.001) (E), Ero1L-1α (*, P = 0.0006) (F), PDI (*, P = 0.003) (G), Atf6 (*, P = 0.013) (H), and IRE1α (P = 0.2, no significant difference) (I). Data were obtained from three experimental replicates, and means were compared using a nonparametric ANOVA with the Kruskal-Wallis test.
FIG 8
FIG 8
Asyn expression does not alter WNV-induced TNF-α, IL-6, or interferon production. Brain tissue was harvested from the indicated regions at day 8 postinoculation with WNV (103 PFU s.c. footpad) to obtain tissue lysates. Following quantification of total protein concentrations, ELISAs for TNF-α (A), IL-6 (*, P = 0.04) (B), interferon alpha (C), and interferon beta (*, P = 0.05) (D) were completed. Data are for three replicates per treatment group, and the mean and SEM for each group are shown.
FIG 9
FIG 9
Asyn expression does not alter CD3+ cell infiltration into the brains of WNV-infected mice. Perfused brain tissue from the indicated regions was harvested at day 8 postinoculation with WNV (103 PFU s.c. footpad) or after mock inoculation and paraffin embedded for immunohistochemistry analysis. Tissue was immunolabeled with antibody to CD3, labeled with NovaRed peroxidase as the secondary antibody, and counterstained using hematoxylin. (A) Representative images of the indicated brain regions from mock-inoculated Snca+/+ mice and WNV-inoculated Snca+/+ and Snca−/− mice. Magnification, ×600. (B) CD3+ cell counts per high-power field in the indicated brain regions and groups determined by an observer blind to the results. Mean CD3+ counts ± SEM are displayed.
FIG 10
FIG 10
WNV does not alter Asyn multimers in primary striatal neuron cultures. Primary striatal neurons were mock or WNV inoculated (MOI, 1) and treated with glutaraldehyde (Glut) at concentrations of 0%, 0.00125%, 0.0025%, or 0.005% upon harvesting at 24 h postinoculation. (A) Representative image of a Western blot obtained with a whole neuronal lysate labeled with antibody to Asyn. Each Western blot was also probed for Rab-GDI as a control for a cellular protein that does not cross-link. The image is representative of the images from three experimental replicates. Triangles on the left of the blot, expected molecular weights of the Asyn monomer, dimer, trimer, and tetramer (from bottom to top, respectively). (B) HEK293T cells were transfected with a plasmid expressing Asyn or green fluorescent protein (GFP)-Asyn. A mean ± SEM transfection efficiency of from 55 to 58% was calculated using IF analysis and antibody to Asyn or green fluorescent protein. Cells were analyzed at 24 h posttransfection, and means from 11 experimental replicates were calculated. PEI, polyethylenimine transfection reagent; Fugene, Fugene HD transfection reagent. (C) HEK293T cells were transfected with plasmids expressing green fluorescent protein alone, Asyn alone, or green fluorescent protein and Asyn. At 24 h posttransfection, cells were inoculated with WNV (MOI, 0.001) and the viral titer in the supernatants was determined at the indicated time points (n = 6 experimental replicates per treatment group).

References

    1. Beckham JD, Tyler KL. 2012. Neuro-intensive care of patients with acute CNS infections. Neurotherapeutics 9:124–138. doi: 10.1007/s13311-011-0086-5. - DOI - PMC - PubMed
    1. Carrera JP, Forrester N, Wang E, Vittor AY, Haddow AD, Lopez-Verges S, Abadia I, Castano E, Sosa N, Baez C, Estripeaut D, Diaz Y, Beltran D, Cisneros J, Cedeno HG, Travassos da Rosa AP, Hernandez H, Martinez-Torres AO, Tesh RB, Weaver SC. 2013. Eastern equine encephalitis in Latin America. N Engl J Med 369:732–744. doi: 10.1056/NEJMoa1212628. - DOI - PMC - PubMed
    1. Solomon T. 2004. Flavivirus encephalitis. N Engl J Med 351:370–378. doi: 10.1056/NEJMra030476. - DOI - PubMed
    1. Ali M, Safriel Y, Sohi J, Llave A, Weathers S. 2005. West Nile virus infection: MR imaging findings in the nervous system. AJNR Am J Neuroradiol 26:289–297. - PMC - PubMed
    1. Armah HB, Wang G, Omalu BI, Tesh RB, Gyure KA, Chute DJ, Smith RD, Dulai P, Vinters HV, Kleinschmidt-DeMasters BK, Wiley CA. 2007. Systemic distribution of West Nile virus infection: postmortem immunohistochemical study of six cases. Brain Pathol 17:354–362. doi: 10.1111/j.1750-3639.2007.00080.x. - DOI - PMC - PubMed

Publication types

MeSH terms

Substances

LinkOut - more resources