. 2015 Dec 30;90(6):2756-66.
doi: 10.1128/JVI.02856-15.

Alveolar Macrophages Are a Prominent but Nonessential Target for Murine Cytomegalovirus Infecting the Lungs

Affiliations

Alveolar Macrophages Are a Prominent but Nonessential Target for Murine Cytomegalovirus Infecting the Lungs

Helen E Farrell et al. J Virol. .

Abstract

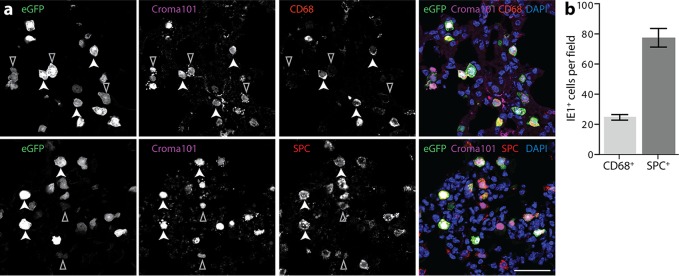
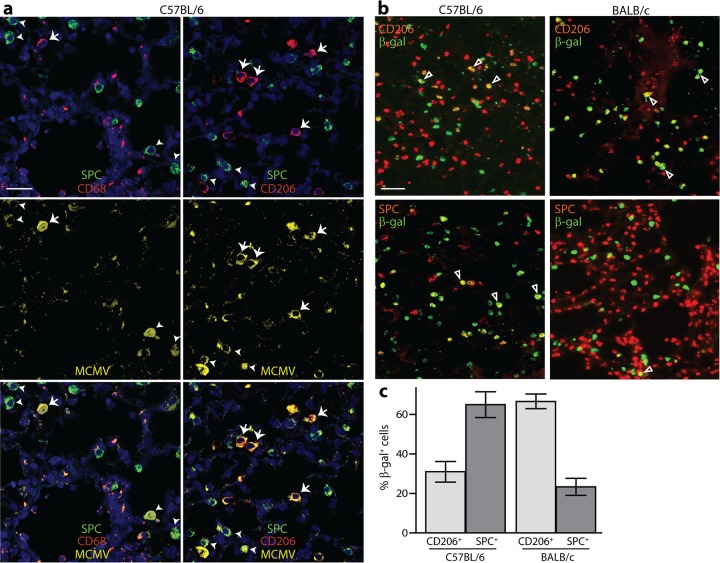
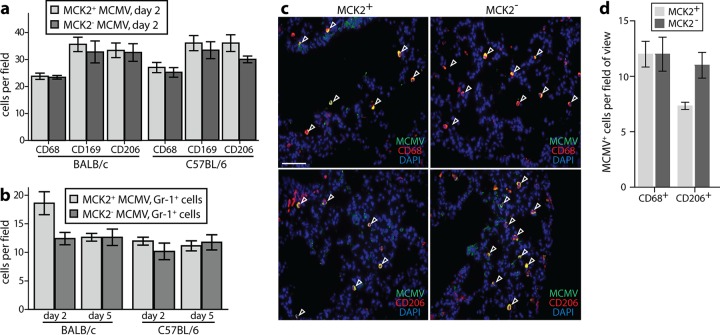
Cytomegaloviruses (CMVs) infect the lungs and cause pathological damage there in immunocompromised hosts. How lung infection starts is unknown. Inhaled murine CMV (MCMV) directly infected alveolar macrophages (AMs) and type 2 alveolar epithelial cells (AEC2s) but not type 1 alveolar epithelial cells (AEC1s). In contrast, herpes simplex virus 1 infected AEC1s and murid herpesvirus 4 (MuHV-4) infected AEC1s via AMs. MCMV-infected AMs prominently expressed viral reporter genes from a human CMV IE1 promoter; but most IE1-positive cells were AEC2s, and CD11c-cre mice, which express cre in AMs, switched the fluorochrome expression of <5% of floxed MCMV in the lungs. In contrast, CD11C-cre mice exhibited fluorochrome switching in >90% of floxed MuHV-4 in the lungs and 50% of floxed MCMV in the blood. AM depletion increased MCMV titers in the lung during the acute phase of infection. Thus, the influence of AMs was more restrictive than permissive. Circulating monocytes entered infected lungs in large numbers and became infected, but not directly; infection occurred mainly via AEC2s. Mice infected with an MCMV mutant lacking its m131/m129 chemokine homolog, which promotes macrophage infection, showed levels of lung infection equivalent to those of wild-type MCMV-infected mice. The level of lung infiltration by Gr-1-positive cells infected with the MCMV m131/m129-null mutant was modestly different from that for wild-type MCMV-infected lungs. These results are consistent with myeloid cells mainly disseminating MCMV from the lungs, whereas AEC2s provide local amplification.

Importance: Cytomegaloviruses (CMVs) chronically and systemically infect most mammals. Human CMV infection is usually asymptomatic but causes lung disease in people with poor immune function. As human infection is hard to analyze, studies with related animal viruses provide important insights. We show that murine CMV has two targets in the lungs: macrophages and surfactant-secreting epithelial cells. Acute virus replication occurred largely in epithelial cells. Macrophages had an important defensive role, as their removal increased the level of infection. These results establish the dual nature of lung infection, with local virus replication occurring in epithelial cells and spread occurring via quiescently infected macrophages. Distinct therapies may be needed to target these contrasting events.


Figures

FIG 1
FIG 1
Example alpha-, beta-, and gammaherpesviruses infect the lungs in different ways. (a) C57BL/6 mice were infected i.n. (3 × 10⁴ PFU) with eGFP+ HSV-1, MCMV, or MuHV-4. After 1 and 4 days, lung sections were stained for virus-expressed eGFP (green in the merge images), cell-type-specific markers (PDP, CD68, and SPC; red in the merge images), and viral (HSV-1, MuHV-4, and MCMV) antigens (cyan in the merge images). Nuclei were stained with DAPI. White arrowheads, example infected cells; gray arrowheads for day 1 MCMV CD68, macrophages containing viral antigen but not viral eGFP; gray arrowhead for day 1 MCMV SPC, a strongly viral antigen-positive AEC2 with low SPC expression (a consistent finding). The data are representative of those for 5 sections each for 3 mice per group. Bar = 50 μm. (b) For each virus, eGFP+ cells were counted across 5 fields per section for 5 sections for 3 mice per group. The bars show the means ± SEMs. MuHV-4 infected significantly more AMs than AEC1s at day 1 and significantly fewer at day 4 (P < 0.0001 by Student's two-tailed unpaired t test). MCMV infected significantly more AEC2s than AMs at day 1 and significantly fewer AEC2s at day 4 (P < 0.001). (c) Mice were infected as described in the legend to panel a. White arrowheads, example viral antigen-positive CD68+ cells with weak or absent staining for virus-expressed eGFP. The data are representative of those for 6 sections each for 3 mice per group. Bar = 50 μm.
FIG 2
FIG 2
MCMV lytically infects mainly AEC2s. (a) C57BL/6 mice were infected i.n. (3 × 10⁴ PFU) with eGFP+ MCMV. One day later, lung sections were stained for viral eGFP (green in the merge images), IE1 (cyan in the merge images), and CD68 or SPC (red in the merge images). Nuclei were stained with DAPI (blue). Closed white arrowheads, example eGFP+ IE1-negative CD68+ and eGFP+ IE1+ SPC+ cells; open white arrowheads, example IE1+ cells that were CD68 (top row) and IE1+ SPC+ cells that were GFPlo (bottom row). (b) IE1+ cells were counted across 5 fields per section for 6 sections for 3 mice per group. The bars show the means ± SEMs. There were significantly more IE1+ SPC+ cells than IE1+ CD68+ cells (P < 10−4 by Student's two-tailed unpaired t test).
FIG 3
FIG 3
MCMV infects both resident and immigrant myeloid cells. (a) BALB/c mice were infected i.n. (3 × 10⁴ PFU) with eGFP+ MCMV, and 1 day later, eGFP+ cells (green) were identified from lung sections by costaining (red) for myeloid cell (CD68, Gr-1, myeloperoxidase [MPO], F4/80, CD206, CD169) and epithelial cell (SPC, PDP) markers. Nuclei were stained with DAPI (blue). Arrowheads, example positive cells. The data are representative of those for 6 sections each for 3 mice per group. Bar = 30 μm. (b) Sections of lung from BALB/c mice infected as described in the legend to panel a or naive mice were stained for Ly-6C (red). Arrowheads, example Ly-6C+ eGFP+ cells. Equivalent results were obtained for 3 mice per group. Bar = 50 μm. (c) BALB/c mice were infected as described in the legend to panel a, and eGFP+ cells were counted across 6 sections each for 3 mice per group. The bars show the means ± SEMs.
FIG 4
FIG 4
cre-dependent virus switching shows limited virus production in the lungs by CD11c+ cells. (a) CD11c-cre mice were infected i.n. with floxed color-switching MCMV K181 (MCMV-GR) or MuHV-4 (MHV-RG) (3 × 10⁴ PFU). Viruses recovered from lungs or whole blood 6 days later were typed for fluorochrome expression. cre switches MCMV-GR from eGFP to tdTomato expression, so percent switching is equal to 100 × [tdTomato+ cell titer/(tdTomato+ cell titer + eGFP+ cell titer)]. cre switches MHV-RG from eGFP to mCherry expression. Circles, data for individual mice; crosses, means. Virus from lungs was significantly less switched than virus from whole blood (P < 10−4 by Student's two-tailed unpaired t test). (b) AEC2s (SPC+) and AMs (CD68+) from mice infected with MCMV-GR as described in the legend to panel a were analyzed for fluorochrome expression by staining of lung sections. Nuclei were stained with DAPI (blue). Filled arrowheads, example tdTomato+ cells, all of which were CD68+ SPC and coexpressed variable amounts of eGFP; open arrowheads, example eGFP+ tdTomato cells, which were >90% CD68 SPC+. The data are representative of those from 2 sections stained for each of 3 mice. Bar = 30 μm. (c) For mice infected and analyzed as described in the legend to panel b, the number of cells in 2 sections from each of 3 mice were counted. Circles, averages for 5 fields for each section; bars, averages for all sections. Twenty-five to 35% of fluorescent cells were tdTomato+. Equivalent results were obtained in 2 replicate experiments. The fluorochrome switching of infected cells was significantly greater than that of virions by Student's two-tailed unpaired t test (P < 0.001).
FIG 5
FIG 5
Both AEC2s and AMs are directly infected by i.n. inoculated MCMV. (a) C57BL/6 mice were infected i.n. with replication-deficient (gL) MCMV K181. One day later, lung sections were stained for markers of AMs (CD68, CD206) and AEC2s (SPC) and for viral (MCMV) antigens. Nuclei were stained with DAPI (blue). Arrows, example antigen-positive AMs; arrowheads, example antigen-positive AEC2s. Bar = 30 μm. (b) C57BL/6 and BALB/c mice were infected with gL MCMV as described in the legend to panel a and then analyzed for viral β-Gal expression in CD206+ and SPC+ cells. Representative images are shown. Arrowheads, example infected cells. BALB/c mice had relatively few infected AEC2s. Bar = 50 μm. (c) Mice were infected as described in the legend to panel b, and the number of β-Gal+ cells across 5 fields of view for each of 3 sections from each of 3 mice per group was counted. The bars show the means ± SEMs for the percentage of β-GAL+ cells detected per field of view. C57BL/6 mice had significantly more infected AEC2s than AMs, and BALB/c mice had significantly more infected AMs than AEC2s (P < 0.01 by Student's two-tailed unpaired t test), but examples of each infected cell type could be identified in each mouse strain.
FIG 6
FIG 6
AM depletion does not prevent MCMV entry into lungs and increases its replication. (a) CD169-DTR mice were given DT i.p. to deplete CD169+ AMs or were not given DT and were then infected i.n. with eGFP+ MCMV (3 × 10⁴ PFU). Infected eGFP+ cells were typed by costaining (red) for markers of AEC2s (SPC), AMs (CD206, CD169, CD68), and immigrant monocytes (Ly-6C). Nuclei were stained with DAPI (blue). Arrowheads, example infected cells. After AM depletion, CD169 expression was abolished and CD206 expression was greatly reduced. CD68 expression was maintained, but very few CD68+ cells were eGFP+. Bar = 50 μm. (b) CD169-DTR mice were depleted or were not depleted of AMs as described in the legend to panel a and then infected with eGFP+ MCMV. One day later, lung sections were stained to identify viral eGFP and antigen (MCMV) expression in Ly-6C+ cells. Nuclei were stained with DAPI. The eGFP channel gain was reduced to make the Ly-6C staining clearer. Arrowheads, example eGFP+ Ly-6C+ viral antigen-positive cells. Bar = 30 μm. (c) eGFP+ cell counts were compared for sections from 3 mice per group from the experiments whose results are presented in panels a and b. The numbers in the bars indicate the cumulative number of eGFP+ cells costaining for the indicated cellular marker/total number of eGFP+ cells detected from at least 3 independent sections. Proportions between undepleted and control groups were compared by Fisher's exact test. Following AM depletion, the proportion of eGFP+/SPC+ cells was unchanged; the proportion of eGFP+/CD206+ or eGFP+/CD169+ cells decreased; the proportion of lytic antigen-positive/Ly 6C+ cells increased. (d) Mice were depleted or not depleted of AMs and infected with MCMV-GR as described in the legend to panel a. One day later, the virus titers in lungs were determined by plaque assay. The bars shows the means, and the symbols show the results for individual mice. The titers in mice depleted of AMs (+DT) were significantly higher than those in the undepleted controls (−DT) (P < 0.05 by Student's two-tailed unpaired t test). (e) Mice were depleted or not depleted of AMs as described in the legend to panel a and then infected i.n. with gL MCMV (3 × 10⁴ PFU). Infected cells were identified by staining for viral β-Gal, AMs were identified by staining for CD206, CD68 provided a pan-macrophage marker, and infiltrating monocytes/granulocytes were identified by staining for Gr-1. Nuclei were stained with DAPI (blue). Arrowheads indicate example infected cells that costain with tested cellular markers. Mice whose AMs were depleted showed CD206+ cell debris but very few CD206+ cells and essentially no infected CD206+, CD68+, or Gr-1+ cells. Bar = 30 μm. (f) β-Gal-positive cell counts were compared for sections from 3 mice per group from the experiment whose results are presented in panel e. The numbers in the bars indicate the cumulative number of β-Gal+ cells costaining for the indicated cellular marker/total number of β-Gal+ cells detected from at least 3 independent sections. The levels of infection of CD206+ and CD68+ cells significantly decreased. The level of infection of Gr-1+ cells remained negligible.
FIG 7
FIG 7
MCMV lacking MCK2 shows no defect in its ability to cause lung infection. (a) BALB/c mice were given MCK2+ or MCK2 MCMV-LUC i.n. (3 × 10⁴ PFU) and then live imaged for viral luciferase expression. Open symbols, results for individual mice; symbols with crosses, means. MCK2+ MCMV gave significantly weaker thoracic signals than MCK2 MCMV at day 3 and significantly stronger cervical signals at days 9 to 17 (P < 0.01 by Student's two-tailed unpaired t test). (b) Mice infected as described in the legend to panel a were analyzed for luciferase expression by imaging dissected organs ex vivo. MCK2+ MCMV gave significantly weaker signals for lung infection than MCK2 MCMV at day 2 and significantly stronger signals for spleen and salivary gland infection at day 5 (P < 0.01). Open symbols, results for individual mice; symbols with crosses, means. (c) C57BL/6 mice were infected as described in the legend to panel a. Two and 5 days later, dissected organs were analyzed for luciferase expression as described in the legend to panel b. Circles, results for individual mice; crosses, means. MCK2+ MCMV caused significantly weaker lung infections than MCK2 MCMV at day 2 and significantly stronger spleen and salivary gland infections at day 5 (P < 0.05). (d) Mice were infected as described in the legend to panel a. Two and 5 days later, the lungs were evaluated for infectious virus by plaque assay. MCK2 MCMV titers were significantly higher in BALB/c mice at days 2 and 5 and in C57BL/6 mice at day 2 (P < 0.03). (e) BALB/c mice were infected i.n. with a K181 strain m131 stop mutant or wild-type strain K181 (MCK2+ MCMV). The virus titers in lungs and salivary glands were determined by plaque assay. Horizontal bars, means; open symbols, results for individual organs. MCK2 MCMV salivary gland titers were significantly lower than MCK2+ MCMV salivary gland titers at day 8 (P < 0.0001). The titers in the other organs were not significantly different between the groups (P > 0.05). (f) Mice were infected as described in the legend to panel e. Four days later, viral genomes in blood were quantitated by PCR. There was no significant difference between MCK2+ MCMV and MCK2 MCMV infections. p.s.−1 · cm−2 · sr−1, photons per second per square centimeter per steradian; SG, salivary gland.
FIG 8
FIG 8
MCK2 promotes early Gr-1+ cell influx in BALB/c but not C57BL/6 mouse lungs. (a) BALB/c and C57BL/6 mice were given MCK2+ or MCK2 MCMV-LUC i.n. (3 × 10⁴ PFU) and 2 days later were analyzed for expression of AM markers. Each bar shows the mean ± SEM for 5 fields per section from 3 sections each for 3 mice per group. No significant differences were observed between MCK2+ MCMV and MCK2 MCMV infections. (b) Mice were infected as described in the legend to panel a and analyzed 2 and 5 days later by immunostaining for expression of the monocyte/granulocyte marker Gr-1 on lung sections. Each bar shows the mean ± SEM for 5 fields per section from 3 sections each for 3 mice per group. MCK2+ MCMV infection of BALB/c mice led to significantly more Gr-1+ cells per field of view at day 2 (P < 0.01 by Student's 2-tailed unpaired t test) but not at day 5. No significant difference between MCK2+ MCMV-infected and MCK2 MCMV-infected C57BL/6 mice was seen (P > 0.2). (c) BALB/c mice were infected as described in the legend to panel a, and lung sections were stained after 2 days for MCMV antigens and for the AM markers CD68 and CD206. Arrowheads, example infected AMs. Bar = 100 μm. (d) MCMV antigen-positive AMs of mice for which the results are illustrated in panel c were counted over 5 fields of view per section on 3 sections from each of 3 mice per group. The bars show the means ± SEMs. MCK2 MCMV infected significantly more MCMV+ CD206+ cells (P < 0.05), with no difference in the number of infected MCMV+ CD68+ cells being detected.

Similar articles

Cited by

References

    1. Bartha A, Juhasz M, Liebermann H. 1966. Isolation of a bovine herpesvirus from calves with respiratory disease and keratoconjunctivitis. A preliminary report. Acta Vet Acad Sci Hung 16:357–358. - PubMed
    1. Cadranel J, Mayaud C. 1995. AIDS and the lung: update 1995. 3. Intrathoracic Kaposi's sarcoma in patients with AIDS. Thorax 50:407–414. - PMC - PubMed
    1. Taus NS, Traul DL, Oaks JL, Crawford TB, Lewis GS, Li H. 2005. Experimental infection of sheep with ovine herpesvirus 2 via aerosolization of nasal secretions. J Gen Virol 86:575–579. doi:10.1099/vir.0.80707-0. - DOI - PubMed
    1. Bell SA, Balasuriya UB, Gardner IA, Barry PA, Wilson WD, Ferraro GL, MacLachlan NJ. 2006. Temporal detection of equine herpesvirus infections of a cohort of mares and their foals. Vet Microbiol 116:249–257. doi:10.1016/j.vetmic.2006.05.002. - DOI - PubMed
    1. Klotman ME, Hamilton JD. 1987. Cytomegalovirus pneumonia. Semin Respir Infect 2:95–103. - PubMed

Publication types

LinkOut - more resources