. 2016 Mar 11;291(11):5484-5499.
doi: 10.1074/jbc.M115.707091. Epub 2015 Dec 30.

Structural and Mechanistic Insights into the Regulation of the Fundamental Rho Regulator RhoGDIα by Lysine Acetylation

Affiliations

Structural and Mechanistic Insights into the Regulation of the Fundamental Rho Regulator RhoGDIα by Lysine Acetylation

Nora Kuhlmann et al. J Biol Chem. .

Abstract

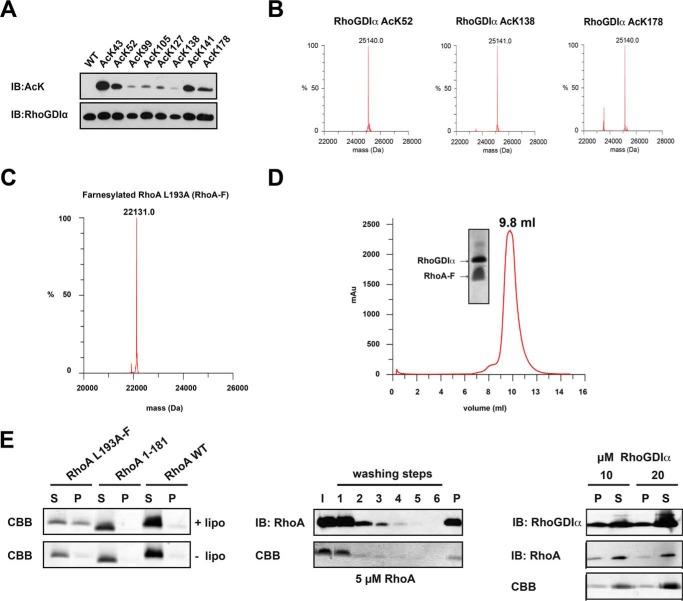
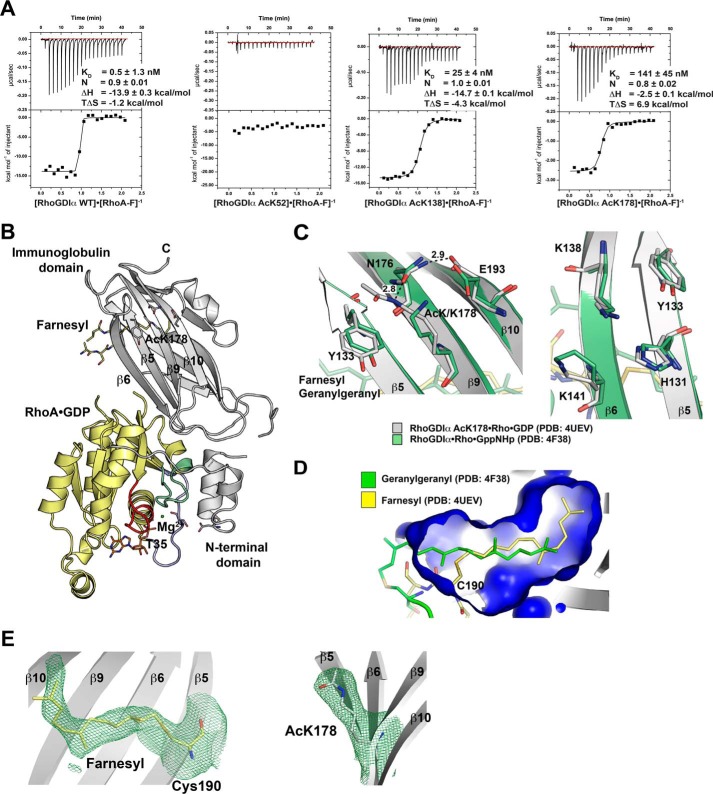
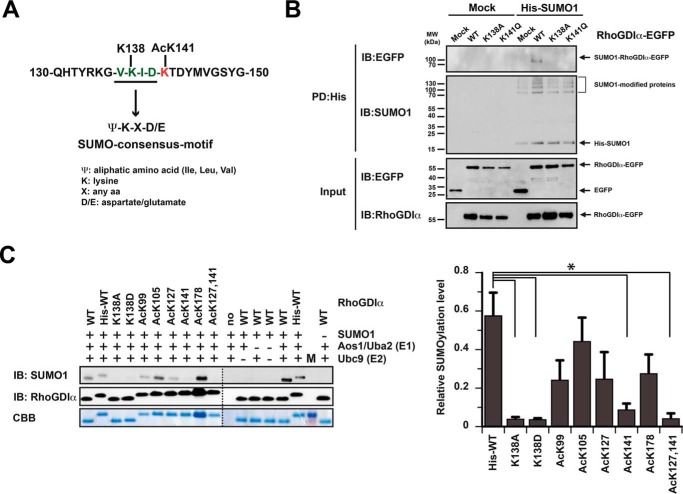
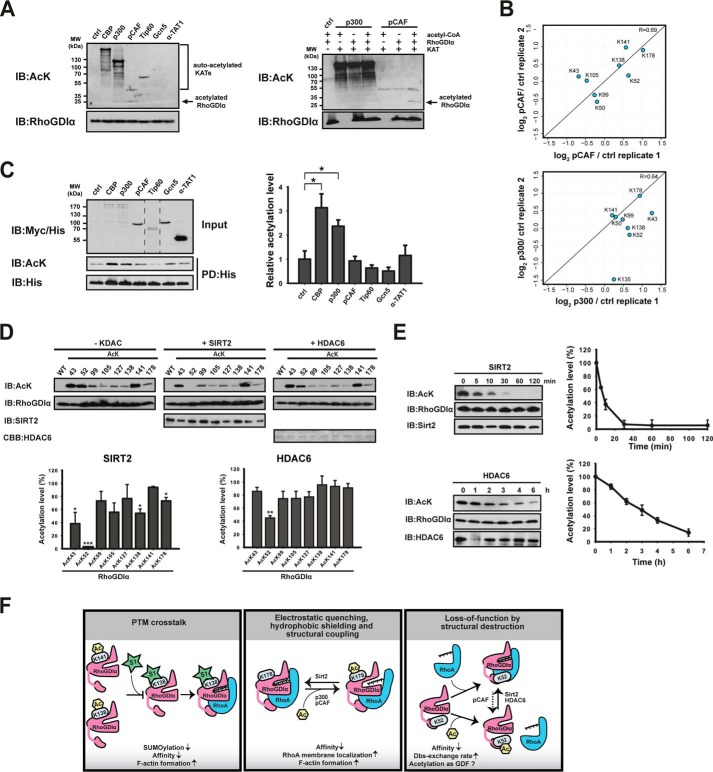
Rho proteins are small GTP/GDP-binding proteins primarily involved in cytoskeleton regulation. Their GTP/GDP cycle is often tightly connected to a membrane/cytosol cycle regulated by the Rho guanine nucleotide dissociation inhibitor α (RhoGDIα). RhoGDIα has been regarded as a housekeeping regulator essential to control homeostasis of Rho proteins. Recent proteomic screens showed that RhoGDIα is extensively lysine-acetylated. Here, we present the first comprehensive structural and mechanistic study to show how RhoGDIα function is regulated by lysine acetylation. We discover that lysine acetylation impairs Rho protein binding and increases guanine nucleotide exchange factor-catalyzed nucleotide exchange on RhoA, these two functions being prerequisites to constitute a bona fide GDI displacement factor. RhoGDIα acetylation interferes with Rho signaling, resulting in alteration of cellular filamentous actin. Finally, we discover that RhoGDIα is endogenously acetylated in mammalian cells, and we identify CBP, p300, and pCAF as RhoGDIα-acetyltransferases and Sirt2 and HDAC6 as specific deacetylases, showing the biological significance of this post-translational modification.

Keywords: Ras homolog gene family, member A (RhoA); Rho (Rho GTPase); acetylation; acetyltransferase; guanine-nucleotide-dissociation inhibitor alpha; histone deacetylase (HDAC); lysine acetylation; lysine acetyltransferase; post-translational modification (PTM); sirtuin.


Figures

FIGURE 1.
FIGURE 1.
RhoGDIα is lysine-acetylated. A, left, overview of reported lysine acetylation sites of RhoGDIα identified in recent quantitative proteomic screens in cells and tissues as indicated. Right, localization of the eight acetylated lysine residues in the RhoA·RhoGDIα structure (PDB entry 4F38). Lys-99, Lys-105, Lys-127, Lys-138, Lys-141, and Lys-178 are in the immunoglobulin domain, and Lys-43 and Lys-52 are in the N-terminal domain. Yellow, RhoA; gray, RhoGDIα. Acetylated lysines are highlighted in red. B, RhoGDIα is endogenously acetylated in HEK293T cells, as shown by immunoprecipitation of lysine acetylated proteins and probing of RhoGDIα. Acetylation is regulated by KDACs, as seen by the increase of acetylated RhoGDIα after incubating the cells with KDAC inhibitors for 6 h. IB for α-tubulin serves as control. +, with KDAC inhibitors; −, without KDAC inhibitors. C, transiently expressed His6-tagged RhoGDIα is acetylated in HEK293T cells, as shown by Ni2+-NTA pull-down (PD) and IB. The Ac-Lys signal increased upon KDAC inhibitor treatment (+). Anti-His IB serves as loading control.
FIGURE 2.
FIGURE 2.
RhoA acetylation interferes with F-actin formation. A, RhoGDIα acetylation induces actin polymerization in HeLaB cells. HeLa cells transiently transfected with RhoGDIα (bottom panels) or RhoGDIα-EGFP (top panels) were stained for filamentous actin (F-actin; red). B, quantitative analysis of F-actin. Shown is the F-actin fluorescence intensity of cells from A normalized to non-transfected cells. The results are depicted as mean ± S.D. (error bars) from three independent experiments. At least 10 cells were examined per condition per experiment. *, p < 0.01; **, p < 0.001 for the indicated comparison. #, p < 0.05 compared with RhoGDIαWT-expressing cells. For statistical analyses, a two-sided Student's t test was performed. Scale bars, 20 μm.
FIGURE 3.
FIGURE 3.
Farnesylated RhoA is functional in binding to RhoGDIα, liposome binding, and extraction by RhoGDIα. A, RhoGDIα is lysine-acetylated using the genetic code expansion concept. The acetyl-l-lysine incorporation was verified by anti-acetyl-l-lysine IB. B, quantitative incorporation of N-(ϵ)-acetyl-l-lysine into RhoGDIα, as judged by ESI-mass spectrometry. The molecular masses correspond exactly (±1 Da) to the protein mass calculated (His6-RhoGDIα, 25,099.1 Da; single-acetylated RhoGDIα, 25,099.1 ± 42 Da; double-acetylated RhoGDIα, 25,099.1 ± 84 Da). C, RhoA is homogeneously and quantitatively farnesylated, as judged by ESI-mass spectrometry (expected mass, 22,131.2 Da). D, analytical size exclusion chromatography of a RhoA-F·RhoGDIα complex (Superdex 75 10/300). RhoA-F binds tightly to RhoGDIα coeluting from the gel filtration column at an elution volume of 9.8 ml. Notably, RhoA-F alone elutes at 11.9 ml (data not shown). E, RhoA-F liposome binding and extraction by RhoGDIα. Left, RhoA binds to liposomes, dependent on the presence of the farnesyl moiety, as shown by a liposome cosedimentation assay. To this end, liposomes were prepared and incubated with RhoA-F, C-terminally deleted RhoA 1–181, and full-length but non-prenylated RhoA. After ultracentrifugation, only the farnesylated full-length RhoA-F was detectable in the pellet fraction and cosedimented with the liposomes, whereas the other RhoA proteins can only be detected in the soluble fraction, as shown by SDS-PAGE and staining with Coomassie Brilliant Blue (CBB). Middle, liposomes can be loaded with farnesylated RhoA-F. After loading of liposomes with farnesylated RhoA-F, non-bound RhoA-F can be removed from the supernatant by consecutive washing. After six washing steps, no RhoA-F can be detected in the supernatant, neither by immunoblotting using a specific anti-RhoA antibody nor by Coomassie Brilliant Blue staining. RhoA-F can be detected only in the pellet fraction after cosedimentation of the liposomes, showing that the liposomes are loaded with RhoA-F. Right, RhoGDIα can solubilize RhoA-F from RhoA-F-loaded liposomes in a concentration-dependent manner. RhoA-F-charged liposomes were treated with increasing concentrations of RhoGDIα, as indicated. With 20 μm RhoGDIα, there is more RhoA-F solubilized from the liposomes compared with the sample with 10 μm RhoGDIα. RhoGDIα is stained by immunoblotting using an anti-RhoGDIα antibody, and RhoA is stained by an anti-RhoA antibody. I, input; S, supernatant; P, pellet.
FIGURE 4.
FIGURE 4.
Lysine acetylation in RhoGDIα impairs binding toward farnesylated RhoA. A, thermodynamic characterization of selected RhoA-F-RhoGDIα interactions, as determined by ITC. Acetylation at Lys-52G abolishes binding toward RhoA-F, and Ac-Lys-138G and Ac-Lys-178G both lead to a reduction in affinity (KD = 141 nm (Ac-Lys-178) and 25 nm (Ac-Lys-138). B, ribbon representation of the RhoA-F·RhoGDIα Ac-Lys-178 complex. The conformation is almost unaltered compared with the RhoA-G·RhoGDIα structure (PDB entry 4F38). Yellow, RhoA; gray, RhoGDIα Ac-Lys-178. The GDP, Mg2+, and T35 from switch I (blue), switch II (green), and the P-loop (red) are highlighted. C, left, Structural coupling of RhoGDIα Ac-Lys-178. Ac-Lys-178G on β9 interacts directly with Tyr-133G on β5 by hydrophobic stacking. Ac-Lys-178G interacts indirectly with Glu-193G on β10, forming a hydrogen bond with Asn-176G on β9. Shown is a close-up from a superposition of the structure solved here (PDB entry 5FR2; gray) with the non-acetylated RhoA-G·RhoGDIα structure (PDB entry 4F38; green). The non-acetylated Lys-178G could not form these interactions. Green, geranylgeranyl from PDB 4F38; yellow, farnesyl from PDB 5FR2. Right, upon acetylation, Lys-138G on β6 might form interactions with His-131G and Tyr-133G on β5. Superposition is as in the left panel. D, the hydrophobic pocket of RhoGDIα Ac-Lys-178 (blue surface; PDB entry 5FR2) accommodates the farnesyl (yellow) of RhoA slightly differently than the geranylgeranyl (green) of RhoA-G·RhoGDIα (PDB entry 4F38). Shown is a superposition of RhoGDIα from the complexes indicated. E, FOFC omit maps of the RhoA-F·GDP·RhoGDIα structure presented here (PDB entry 5FR2). Shown is the electron density of the farnesyl moiety (left) and the Ac-Lys-178 on β9 of RhoGDIα countered at 1.5 σ.
FIGURE 5.
FIGURE 5.
RhoGDIα acetylation directly and indirectly interferes with Lys-138 SUMOylation. A, SUMO consensus sequence of RhoGDIα (aa 130–150). B, RhoGDIα K141Q blocks K138-SUMOylation in vivo. HeLa T-REx cells stably expressing His6-SUMO1 or empty vector (mock) were transfected with indicated RhoGDIα-EGFP constructs. Shown is a pull-down (PD) of His6-SUMO1-modified proteins by Ni2+-NTA beads. Eluates and input were probed with the indicated antibodies. C, RhoGDIα Ac-Lys-141 blocks Lys-138 SUMOylation in vitro. Left, K138AG/K138DG were not SUMOylated (direct cross-talk), and Ac-Lys-141G abolishes SUMOylation (indirect cross-talk). Coomassie Brilliant Blue (CBB) staining and RhoGDIα IB served as loading control. Right, quantification of RhoGDIα SUMOylation. K138AG, K138DG, Ac-Lys-141G, and Ac-Lys-127,141G were significantly less SUMOylated as compared with RhoGDIαWT. Results are shown as mean ± S.E. (error bars) The experiment was performed independently three times. *, p < 0.05; two-sided Student's t test.
FIGURE 6.
FIGURE 6.
Influence of RhoGDIα acetylation on RhoA membrane extraction and GEF-catalyzed nucleotide dissociation. A, extraction of endogenous RhoA from HEK293T membrane fractions by lysine-acetylated RhoGDIα proteins. The RhoA content extracted was analyzed by IB (left). RhoA of the supernatant was quantified using ImageJ software and normalized to the RhoGDIα amount. Results are shown as mean ± S.E. (error bars) from six independent experiments. Only Ac-Lys-52G shows a statistical significance compared with RhoGDIαWT. *, p < 0.05 for the indicated comparison (right). S, supernatant; M1, membrane fraction before solubilization; M2, membrane fraction after solubilization. B, influence of RhoGDIα acetylation on Dbs-GEF-catalyzed nucleotide exchange on RhoA. 1 μm RhoGDIα·RhoA·mantGDP-complex was incubated with 0.5 μm Dbs-GEF and a 50-fold molar excess (50 μm) of unlabeled GDP. The acetylation of RhoGDIα at Lys-52 decreases the inhibitory effect, whereas the other acetylation sites do not interfere with nucleotide exchange on RhoA. Data represent the mean from three independent experiments. C, position of Lys-52 and Lys-43 in the N-terminal RhoGDIα domain, as judged from the RhoA·RhoGDIα Ac-Lys-127,141 structure presented here (color code as in Fig. 5B). Lys-52G is an integral part of the N-terminal domain within hydrogen bond distance to Tyr-63R in switch II and the main chain carbonyl oxygen of Leu-41G. The side chain of Lys-43G is surface-exposed.
FIGURE 7.
FIGURE 7.
Regulation of RhoGDIα acetylation by KDACs and KATs. A, RhoGDIα is acetylated by p300 and pCAF in vitro (left). As a control for the specificity of RhoGDIα acetylation catalyzed by p300 and pCAF and to exclude non-enzymatic acetylation, reactions were performed in the absence of KAT, RhoGDIα, or acetyl-CoA (right). Acetylation was visualized by IB using an anti-Ac-Lys antibody. B, correlation scatter plot of RhoGDIα acetylation sites identified by mass spectrometry. Plotted are the log2 results of two replicates for pCAF (top) and p300 (bottom). Shown are the ratios of the KAT-treated versus control samples. C, in vivo KAT assay. His6-RhoGDIα was cotransfected with expression constructs of various KATs (CBP, p300, pCAF, Tip60, Gcn5, and α-TAT1), and acetylation was assessed by Ni2+-NTA pull-down (PD) and IB (left). Quantifications were done using ImageJ software by normalizing the acetylation signal to the amount of overexpressed RhoGDIα. Shown is the mean ± S.E. from five independent experiments. Only for p300 and CBP do we observe a statistically significant increase in RhoGDIα acetylation compared with the non-enzyme control. *, p < 0.01 for the indicated comparison (right). D, Sirt2 and HDAC6 are RhoGDIα deacetylases. 2 μg of acetylated RhoGDIα proteins were incubated with 0.5 μg of Sirt2 or HDAC6 for 4 h at room temperature. Reaction products were analyzed by IB (top panels). For Sirt2, we observed a statistically significant deacetylation for Ac-Lys-52G, Ac-Lys-138G, and Ac-Lys-178G, and for HDAC6, we observed this only for Ac-Lys-52G. The quantification was done using ImageJ by normalizing to the samples without KDACs (bottom panels). Values represent the mean ± S.E. (error bars) of three independent experiments. *, p < 0.05; **, p < 0.005; ***, p < 0.001, statistically significant difference from samples without KDACs. E, kinetics for RhoGDIα Ac-Lys-52G deacetylation by Sirt2 and HDAC6. 2 μg of Ac-Lys-52G were incubated with either Sirt2 (0.25 μg) or HDAC6 (0.5 μg). Quantification of the acetylation level was done using ImageJ software and normalizing it to the band intensity at t = 0 min. Shown is the mean ± S.D. (error bars) from three independent experiments. F, working model for the regulation of RhoGDIα function by lysine acetylation. Left, indirect cross-talk of Lys-141G acetylation and Lys-138G SUMOylation and direct cross-talk by acetylation of Lys-138G affecting RhoA-affinity; middle, electrostatic quenching, hydrophobic shielding, and structural coupling of Ac-Lys-178G, decreasing RhoA affinity and thereby increasing cellular F-actin content; right, acetylation of Lys-52G in the RhoGDIα N-terminal domain results in loss of function by structural destruction.

References

    1. Hall A. (1998) Rho GTPases and the actin cytoskeleton. Science 279, 509–514 - PubMed
    1. Gundersen G. G., Wen Y., Eng C. H., Schmoranzer J., Cabrera-Poch N., Morris E. J., Chen M., and Gomes E. R. (2005) Regulation of microtubules by Rho GTPases in migrating cells. Novartis Found. Symp. 269, 106–116; discussion 116–126, 223–230 - PubMed
    1. Jaffe A. B., and Hall A. (2005) Rho GTPases: biochemistry and biology. Annu. Rev. Cell Dev. Biol. 21, 247–269 - PubMed
    1. Vetter I. R., and Wittinghofer A. (2001) The guanine nucleotide-binding switch in three dimensions. Science 294, 1299–1304 - PubMed
    1. Bos J. L., Rehmann H., and Wittinghofer A. (2007) GEFs and GAPs: critical elements in the control of small G proteins. Cell 129, 865–877 - PubMed

Publication types

MeSH terms

LinkOut - more resources