Cyclable Condensation and Hierarchical Assembly of Metastable Reflectin Proteins, the Drivers of Tunable Biophotonics
- PMID: 26719342
- PMCID: PMC4759182
- DOI: 10.1074/jbc.M115.686014
Cyclable Condensation and Hierarchical Assembly of Metastable Reflectin Proteins, the Drivers of Tunable Biophotonics
Abstract
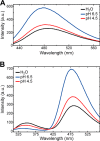
Reversible changes in the phosphorylation of reflectin proteins have been shown to drive the tunability of color and brightness of light reflected from specialized cells in the skin of squids and related cephalopods. We show here, using dynamic light scattering, electron microscopy, and fluorescence analyses, that reversible titration of the excess positive charges of the reflectins, comparable with that produced by phosphorylation, is sufficient to drive the reversible condensation and hierarchical assembly of these proteins. The results suggest a two-stage process in which charge neutralization first triggers condensation, resulting in the emergence of previously cryptic structures that subsequently mediate reversible, hierarchical assembly. The extent to which cyclability is seen in the in vitro formation and disassembly of complexes estimated to contain several thousand reflectin molecules suggests that intrinsic sequence- and structure-determined specificity governs the reversible condensation and assembly of the reflectins and that these processes are therefore sufficient to produce the reversible changes in refractive index, thickness, and spacing of the reflectin-containing subcellular Bragg lamellae to change the brightness and color of reflected light. This molecular mechanism points to the metastability of reflectins as the centrally important design principle governing biophotonic tunability in this system.
Keywords: biomaterials; biophotonics; intrinsically disordered protein; iridescence; protein aggregation; protein assembly; protein metastability; protein self-assembly; reflectins; tunable.
© 2016 by The American Society for Biochemistry and Molecular Biology, Inc.
Figures


Similar articles
-
Calibration between trigger and color: Neutralization of a genetically encoded coulombic switch and dynamic arrest precisely tune reflectin assembly.J Biol Chem. 2019 Nov 8;294(45):16804-16815. doi: 10.1074/jbc.RA119.010339. Epub 2019 Sep 26. J Biol Chem. 2019. PMID: 31558609 Free PMC article.
-
A Mini-Review on Reflectins, from Biochemical Properties to Bio-Inspired Applications.Int J Mol Sci. 2022 Dec 10;23(24):15679. doi: 10.3390/ijms232415679. Int J Mol Sci. 2022. PMID: 36555320 Free PMC article. Review.
-
Structures, Organization, and Function of Reflectin Proteins in Dynamically Tunable Reflective Cells.J Biol Chem. 2015 Jun 12;290(24):15238-49. doi: 10.1074/jbc.M115.638254. Epub 2015 Apr 26. J Biol Chem. 2015. PMID: 25918159 Free PMC article.
-
Charge screening and hydrophobicity drive progressive assembly and liquid-liquid phase separation of reflectin protein.J Biol Chem. 2025 Mar;301(3):108277. doi: 10.1016/j.jbc.2025.108277. Epub 2025 Feb 6. J Biol Chem. 2025. PMID: 39922493 Free PMC article.
-
An introduction to color-changing systems from the cephalopod protein reflectin.Bioinspir Biomim. 2018 May 25;13(4):045001. doi: 10.1088/1748-3190/aab804. Bioinspir Biomim. 2018. PMID: 29799434 Review.
Cited by
-
Voltage-calibrated, finely tunable protein assembly.J R Soc Interface. 2023 Jul;20(204):20230183. doi: 10.1098/rsif.2023.0183. Epub 2023 Jul 5. J R Soc Interface. 2023. PMID: 37403486 Free PMC article.
-
Synthetic biology for fibres, adhesives and active camouflage materials in protection and aerospace.MRS Commun. 2019 May 15;9(2):486-504. doi: 10.1557/mrc.2019.35. Epub 2019 Apr 24. MRS Commun. 2019. PMID: 31281737 Free PMC article.
-
Calibration between trigger and color: Neutralization of a genetically encoded coulombic switch and dynamic arrest precisely tune reflectin assembly.J Biol Chem. 2019 Nov 8;294(45):16804-16815. doi: 10.1074/jbc.RA119.010339. Epub 2019 Sep 26. J Biol Chem. 2019. PMID: 31558609 Free PMC article.
-
Recent advances in bioelectronics chemistry.Chem Soc Rev. 2020 Nov 21;49(22):7978-8035. doi: 10.1039/d0cs00333f. Epub 2020 Jul 16. Chem Soc Rev. 2020. PMID: 32672777 Free PMC article. Review.
-
A Mini-Review on Reflectins, from Biochemical Properties to Bio-Inspired Applications.Int J Mol Sci. 2022 Dec 10;23(24):15679. doi: 10.3390/ijms232415679. Int J Mol Sci. 2022. PMID: 36555320 Free PMC article. Review.
References
-
- Boal J. G., Shashar N., Grable M. M., Vaughan K. H., Loew E. R., and Hanlon R. T. (2004) Behavioral evidence for intraspecific signaling with achromatic and polarized light by cuttlefish (Mollusca: Cephalopoda). Behavior 141, 837–861
-
- Crookes W. J., Ding L.-L., Huang Q. L., Kimbell J. R., Horwitz J., and McFall-Ngai M. J. (2004) Reflectins: the unusual proteins of squid reflective tissues. Science 303, 235–238 - PubMed
Publication types
MeSH terms
Substances
LinkOut - more resources
Full Text Sources
Other Literature Sources

