. 2015 Dec 30;108(6):djv406.
doi: 10.1093/jnci/djv406. Print 2016 Jun.

Connecting the Dots: Therapy-Induced Senescence and a Tumor-Suppressive Immune Microenvironment

Affiliations

Connecting the Dots: Therapy-Induced Senescence and a Tumor-Suppressive Immune Microenvironment

Anna E Vilgelm et al. J Natl Cancer Inst. .

Abstract

Background: Tumor cell senescence is a common outcome of anticancer therapy. Here we investigated how therapy-induced senescence (TIS) affects tumor-infiltrating leukocytes (TILs) and the efficacy of immunotherapy in melanoma.

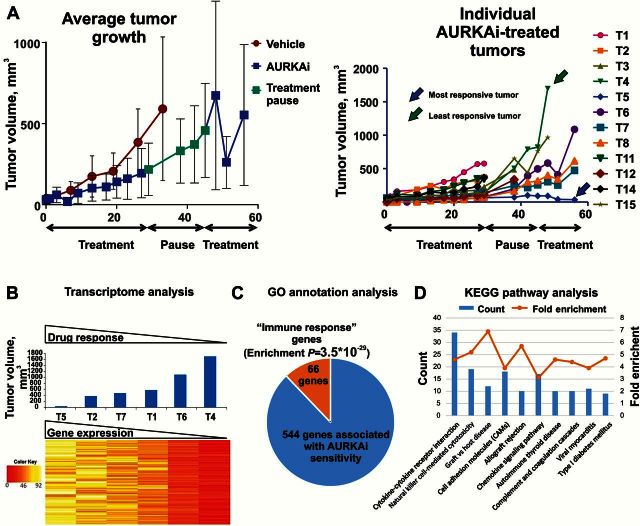
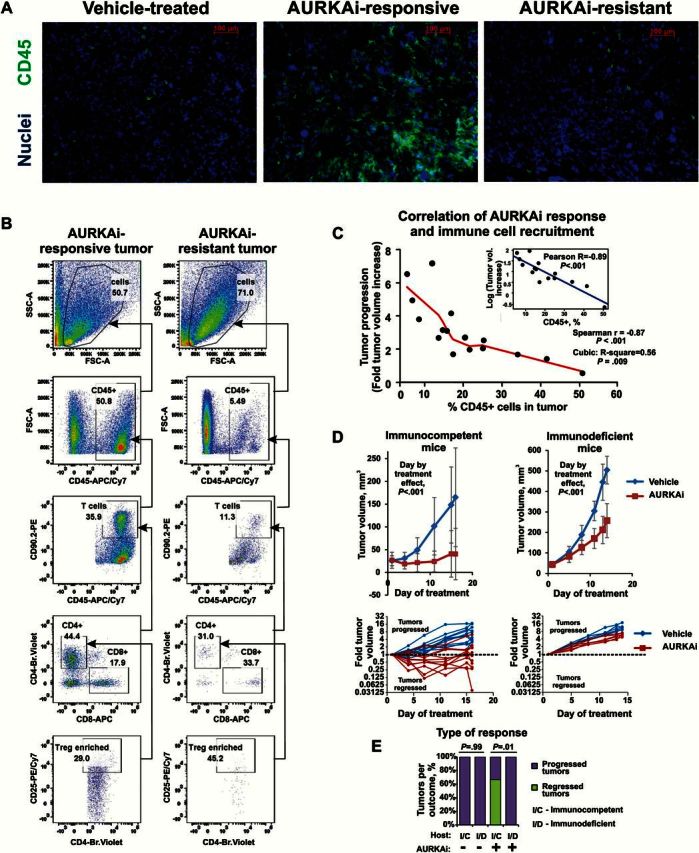
Methods: Tumor senescence was induced by AURKA or CDK4/6 inhibitors (AURKAi, CDK4/6i). Transcriptomes of six mouse tumors with differential response to AURKAi were analyzed by RNA sequencing, and TILs were characterized by flow cytometry. Chemokine RNA and protein expression were determined by quantitative real-time polymerase chain reaction and enzyme-linked immunosorbent assay. Therapeutic response was queried in immunodeficient mice, in mice with CCL5-deficient tumors, and in mice cotreated with CD137 agonist to activate TILs. CCL5 expression in reference to TIS and markers of TILs was studied in human melanoma tumors using patient-derived xenografts (n = 3 patients, n = 3 mice each), in AURKAi clinical trial samples (n = 3 patients, before/after therapy), and in The Cancer Genome Atlas (n = 278). All statistical tests were two-sided.

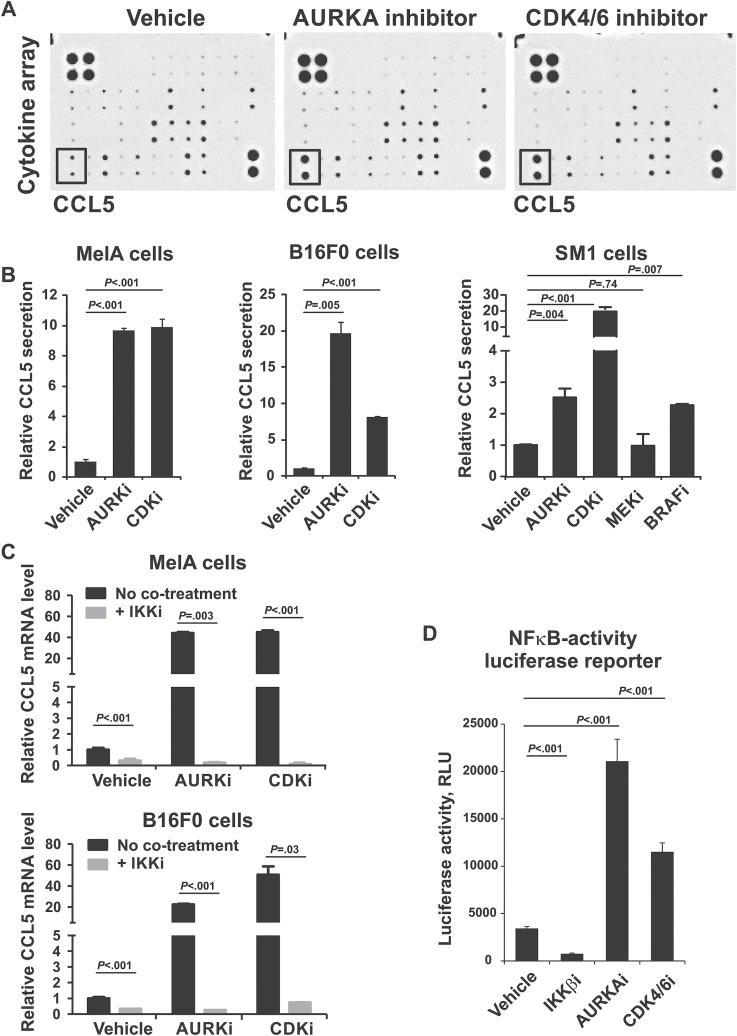
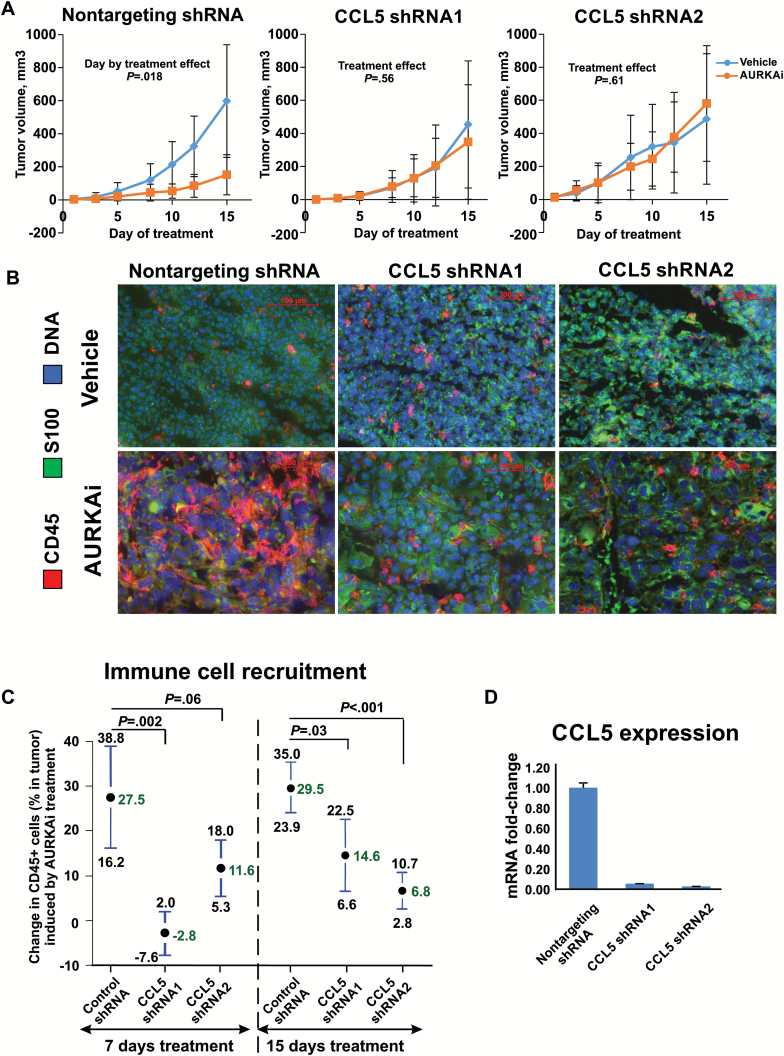
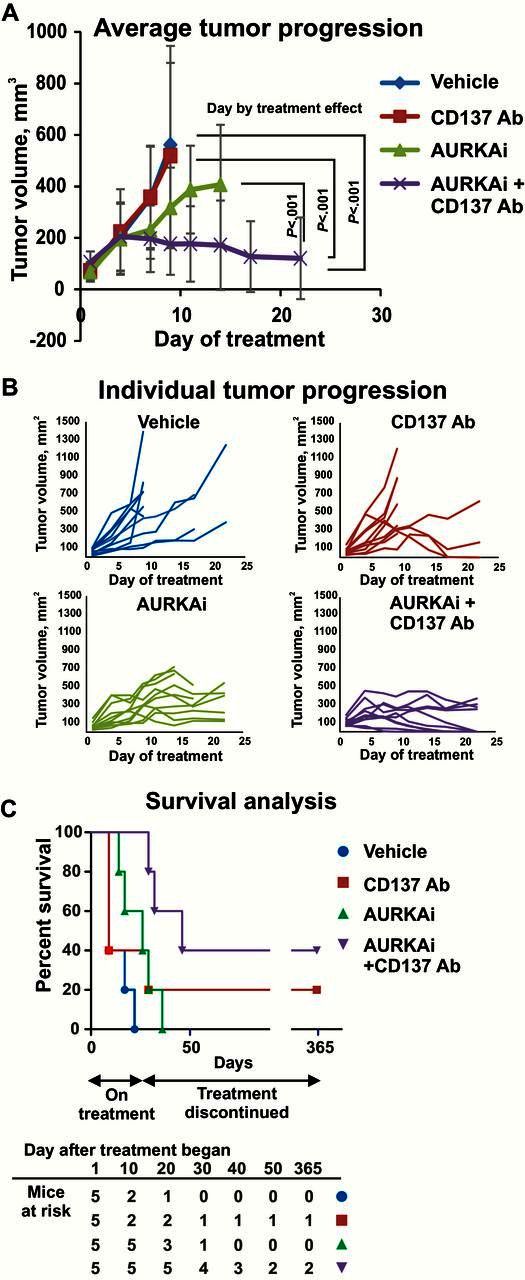
Results: AURKAi response was associated with induction of the immune transcriptome (P = 3.5 x 10⁻²⁹) while resistance inversely correlated with TIL numbers (Spearman r = -0.87, P < .001). AURKAi and CDK4/6i promoted the recruitment of TILs by inducing CCL5 secretion in melanoma cells (P ≤ .005) in an NF-κB-dependent manner. Therapeutic response to AURKAi was impaired in immunodeficient compared with immunocompetent mice (0% vs 67% tumors regressed, P = .01) and in mice bearing CCL5-deficient vs control tumors (P = .61 vs P = .02); however, AURKAi response was greatly enhanced in mice also receiving T-cell-activating immunotherapy (P < .001). In human tumors, CCL5 expression was also induced by AURKAi (P ≤ .02) and CDK4/6i (P = .01) and was associated with increased immune marker expression (P = 1.40 x 10-93).

Conclusions: Senescent melanoma cells secret CCL5, which promotes recruitment of TILs. Combining TIS with immunotherapy that enhances tumor cell killing by TILs is a promising novel approach to improve melanoma outcomes.


Figures

Figure 1.
Figure 1.
Analysis of transcriptome in tumors with differential response to mitotic inhibition. A) The average (left panel) and individual progression (right panel) of melanoma tumors treated with alisertib. C57Bl/6 mice bearing MelA melanoma tumors were treated with 30mg/kg of AURKAi (alisertib, n = 8) or vehicle (water, n = 41). Error bars represent SD. B) Heat map of the expression levels of 544 genes that were statistically significantly associated with response to AURKAi therapy (final tumor volume, blue bars) as determined by SAM software with FDR 10%. C) Enrichment of the GO annotation “immune response” in the set of 544 genes associated with AURKAi response. D) Top 10 most enriched KEGG pathways in the set of 544 genes associated with AURKAi response. Count: number of genes in a 544 set that are involved in a given pathway. Fold enrichment shows how many fold more a given term was overrepresented in the 544 gene set compared with a background of the total mouse genome.
Figure 2.
Figure 2.
Analysis of immune cell recruitment in response to mitotic kinase inhibition. A) Immuno-fluorescent staining of pan-leukocyte marker CD45 in tumors with differential responses to AURKAi shown in Supplementary Figure 1 (available online). C57Bl6 mice bearing MelA melanoma tumors were treated with 30mg/kg of AURKAi (n = 10) or vehicle (n = 3). After four weeks of therapy, treatment was paused for two weeks then resumed for another two weeks to establish differential tumor response. Tumor tissue was snap-frozen at the end of study and subsequently used for immunofluorescent staining. Responsive and resistant tumors represent tumors that showed less than two-fold and over four-fold volume increase after second therapy round, respectively. B) Results of the flow cytometry–based analysis of the tumor-infiltrating immune cells in tumors described in Supplementary Figure 1 (available online). CD90.2+, CD25+: Treg-enriched population was gated based on fluorescence-minus-one control. One representative responding (AURKAi 7) and one representative nonresponding tumor (AURKAi 2) are shown. C) Scatter plot of the final tumor volume (resistance) and tumor infiltration with immune cells (%CD45 cells) shows very strong inverse correlation. Insert shows linear correlation of log-transformed tumor progression values with the percent of tumor-infiltrating CD45+ cells. D) Cells derived from AURKAi-sensitive tumor were injected into 12 immunocompetent C57Bl/6 (top panels) or six severely immune-deficient NSG mice (top panels) at 5x10⁶ cells/flank on both flanks. Mice were divided into two groups that were treated daily with 30mg/kg of AURKAi (alisertib) or vehicle (water). Tumor volume increase over time is shown. A nested mixed-effects model was fitted to compare tumor volume between immunocompetent CD57Bl and immunodeficient NSG mice with a random effect for the intercept for each mouse and for each flank of each mouse. To better meet normality assumptions for the analysis model, a square root transformation of tumor volumes was performed to adjust for heteroscedacity observed over time. E) Comparison of the therapeutic outcomes (tumor progressed vs tumor regressed) in immunocompetent C57Bl/6 and in severely immune-deficient NSG mice in the experiment shown in (D). Fisher’s exact test was used to compare outcomes in different host types. All statistical tests were two-sided. Error bars represent SD.
Figure 3.
Figure 3.
Effect of senescence-inducing therapy on expression and secretion of CCL5 by melanoma cells. A) Cytokine array analysis of the condition media from the MelA cell cultured for five days with 1 uM AURKA inhibitor alisertib, 10 µM CDK4/6 inhibitor palbociclib, or vehicle control (DMSO). Rectangular frame shows the position of CCL5. Complete list of cytokines detected by the array is listed in the Supplementary Methods (available online). B) Enzyme-linked immunosorbent assay of the condition media from indicated cells treated with DMSO (vehicle), 1 µM alisertib (AURKAi), 10 µM palbociclib (CDK4/6i), 1 µM MEK inhibitor selumetinib (MEKi), and 1 µM BRAF inhibitor vemurafenib (BRAFi) for five days. The levels of secreted CCL5 were normalized to total protein level in cell lysates. C) Real-time polymerase chain reaction analysis of CCL5 mRNA expression in MelA and B16F0 cells treated for five days with 1 µM AURKAi or 10 µM CDK4/6i in the presence (+IKKi) or absence (no cotreatment) of 10 µM of IKKβ inhibitor BMS-345541. The levels of CCL5 mRNA were normalized to β-Actin mRNA. D) Luciferase reporter of NFκB activity. HS295T human melanoma cells stably expressing a luciferase NF-κB reporter were treated for three days with 10 µM of IKKβ inhibitor BMS-345541, 1 µM alisertib (AURKAi), or 10 µM palbociclib (CDK4/6i). Data shown in (B-D) are representative of three independent experiments. Error bar represents standard deviation. Statistical comparison is illustrated by P values that were based on analysis of variance (ANOVA) model linear contrasts. For experiments in (C and D), data were log-transformed to meet the ANOVA model statistical assumptions. All statistical tests were two-sided.
Figure 4.
Figure 4.
The role of CCL5 induction in therapeutic response to AURKAi and recruitment of immune cells into the tumor. A) Therapeutic response to AURKAi in C57Bl/6 mice bearing B16F0 melanoma tumors expressing nontargeting shRNA or shRNA targeting CCL5 (CCL5 shRNA1 and CCL5 shRNA2). Mice bearing each tumor type were split into two groups for daily treatments with 30mg/kg of AURKAi (n = 5) or vehicle (n = 5). A linear mixed-effects model was fitted to compare tumor volume in vehicle and AURKAi treatment groups adjusted for day of treatment as described in the Methods section. Tumor volume values were log-transformed to meet the assumption of normality. B) Immunofluorescent staining of tumor-infiltrating immune cells in tumors obtained after 15 days of treatment (shown in [A]) using CD45-specific antibody. C) Results of the flow cytometry–based analysis of the tumor-infiltrating leukocytes obtained from vehicle-treated mice or mice treated with 30mg/kg of AURKAi. Two independent experiments were performed to analyze tumors on day 7 or on day 15 (shown in [A]) after the beginning of treatment. AURKAi effect on the percent of CD45+ cells was compared in CCL5 knockdown and nontargeting shRNA groups using pooled variance t test. The mean drug effect (difference in the percentage of CD45+ cells in between vehicle and AURKAi-treated mice) ± pooled SD is plotted. D) The efficiency of CCL5 knockdown was analyzed by real-time polymerase chain reaction after reverse transcription. All statistical tests were two-sided.
Figure 5.
Figure 5.
Effect of senescence-inducing therapy on tumor response to T-cell stimulation with CD137 agonist antibody. A) Average progression of the SM1 melanoma tumors grown in C57Bl6 mice that were treated with 30mg/kg of AURKAi (5 mice bearing 2 tumors each) or vehicle (5 mice, 2 tumors each) and injected with anti-CD137 antibody (115µg i.p.) or isotype control every other day. A linear mixed-effects model was fitted to compare tumor volume in treatment groups and calculate P values. This test was two-sided. To meet the normality assumptions, square root transformations of tumor volumes were performed. Error bars represent SD. B) Tumor volume changes over the treatment course are shown for each individual tumor described in (A). Survival of SM1 tumor-bearing mice treated as described in (A). Mice were monitored for 12 months after the completion of the therapy.
Figure 6.
Figure 6.
Analysis of CCL5 expression in human melanoma tumors in response to senescent-inducing therapy and its association with tumor-suppressive immune microenvironment. A) Induction of CCL5 expression by senescence-inducing therapy in patient-derived melanoma tumors. Nude mice bearing subcutaneous PDX tumors were treated with vehicle, 30mg/kg of AURKAi, or 100mg/kg CDK4/6i (LEE011) for two to four weeks until the tumors in control group reached 15mm in diameter. CCL5 mRNA expression was analyzed in tumors from three mice in each treatment group using real-time polymerase chain reaction. The levels of CCL5 mRNA were normalized to β-Actin mRNA. The statistical significance of the deference between CCL5 levels in tumors of vehicle- and AURKAi- or CDK4/6i-treated mice was analyzed using linear mixed-effects regression; base 2 logarithmic transformation of expression fold-change was performed. B) Genes co-expressed with CCL5 in human melanoma tumors. CBio portal analysis was performed on The Cancer Genome Atlas (TCGA) melanoma tumor collection. Genes showing very strong (Pearson correlation coefficient r > 0.9) positive relationship with CCL5 are displayed. C) Scatter plots demonstrating co-expression of selected genes (pan-leukocyte marker CD45, cytotoxic T-cell marker CD8A, and protease of cytotoxic immune cells granzyme B) with CCl5. Analysis of the TCGA melanoma dataset performed using CBio portal resource. D) Induction of CCL5 expression by AURKAi treatment in human melanoma tumors. The levels of CCL5 mRNA were normalized to β-Actin mRNA. Tumor tissue from patients treated with AURKAi was sampled before the AURKAi treatment was initiated and five to seven months after the trial therapy started. Response was determined in accordance with the Response Evaluation Criteria In Solid Tumors (RECIST). E) Immunofluorescent staining of tumor-infiltrating CD8+ cells in samples from patients enrolled in AURKAI trial. All tests of statistical significance were two-sided. Error bars represent SD. TCGA = The Cancer Genoma Atlas.

Similar articles

Cited by

References

    1. Balch CM, Gershenwald JE, Soong SJ, et al. Final version of 2009 AJCC melanoma staging and classification. J Clin Oncol. 2009;27(36):6199–6206. - PMC - PubMed
    1. Robert C, Karaszewska B, Schachter J, et al. Improved overall survival in melanoma with combined dabrafenib and trametinib. N Engl J Med. 2015;372(1):30–39. - PubMed
    1. Sosman JA, Kim KB, Schuchter L, et al. Survival in BRAF V600-mutant advanced melanoma treated with vemurafenib. N Engl J Med. 2012;366(8):707–714. - PMC - PubMed
    1. Topalian SL, Hodi FS, Brahmer JR, et al. Safety, activity, and immune correlates of anti-PD-1 antibody in cancer. N Engl J Med. 2012;366(26):2443–2454. - PMC - PubMed
    1. Hamid O, Robert C, Daud A, et al. Safety and tumor responses with lambrolizumab (anti-PD-1) in melanoma. N Engl J Med. 2013;369(2):134–144. - PMC - PubMed

Publication types

MeSH terms