. 2016 Mar 15;76(6):1335-47.
doi: 10.1158/0008-5472.CAN-15-0204. Epub 2015 Dec 30.

Activation of Hematopoietic Stem/Progenitor Cells Promotes Immunosuppression Within the Pre-metastatic Niche

Affiliations

Activation of Hematopoietic Stem/Progenitor Cells Promotes Immunosuppression Within the Pre-metastatic Niche

Amber Jin Giles et al. Cancer Res. .

Abstract

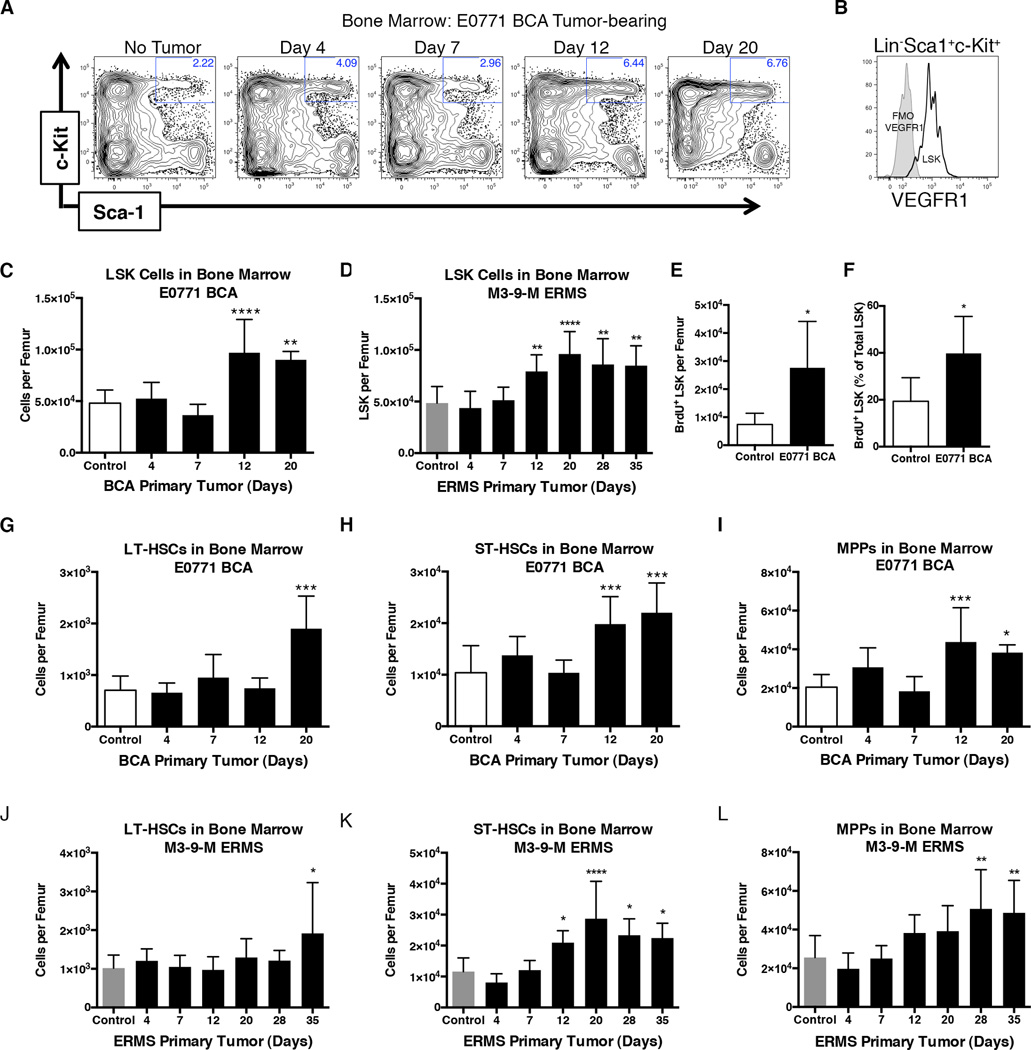
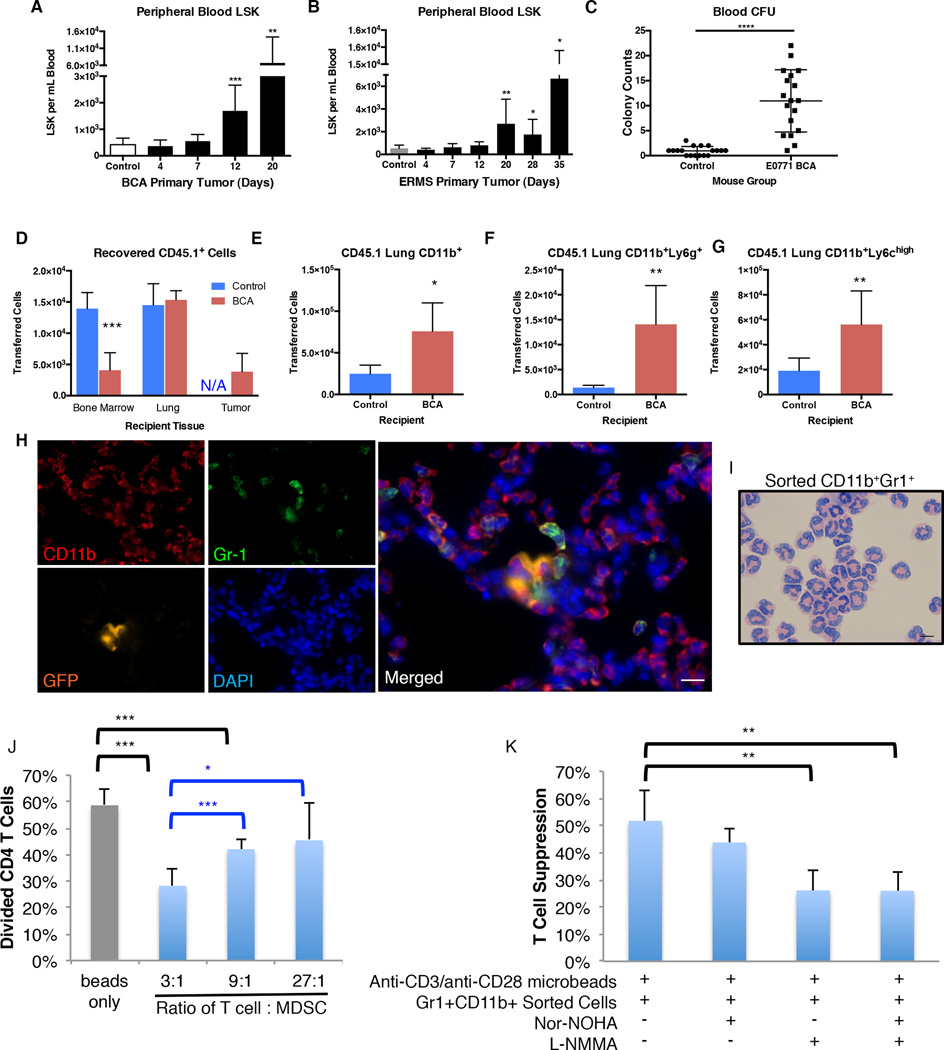
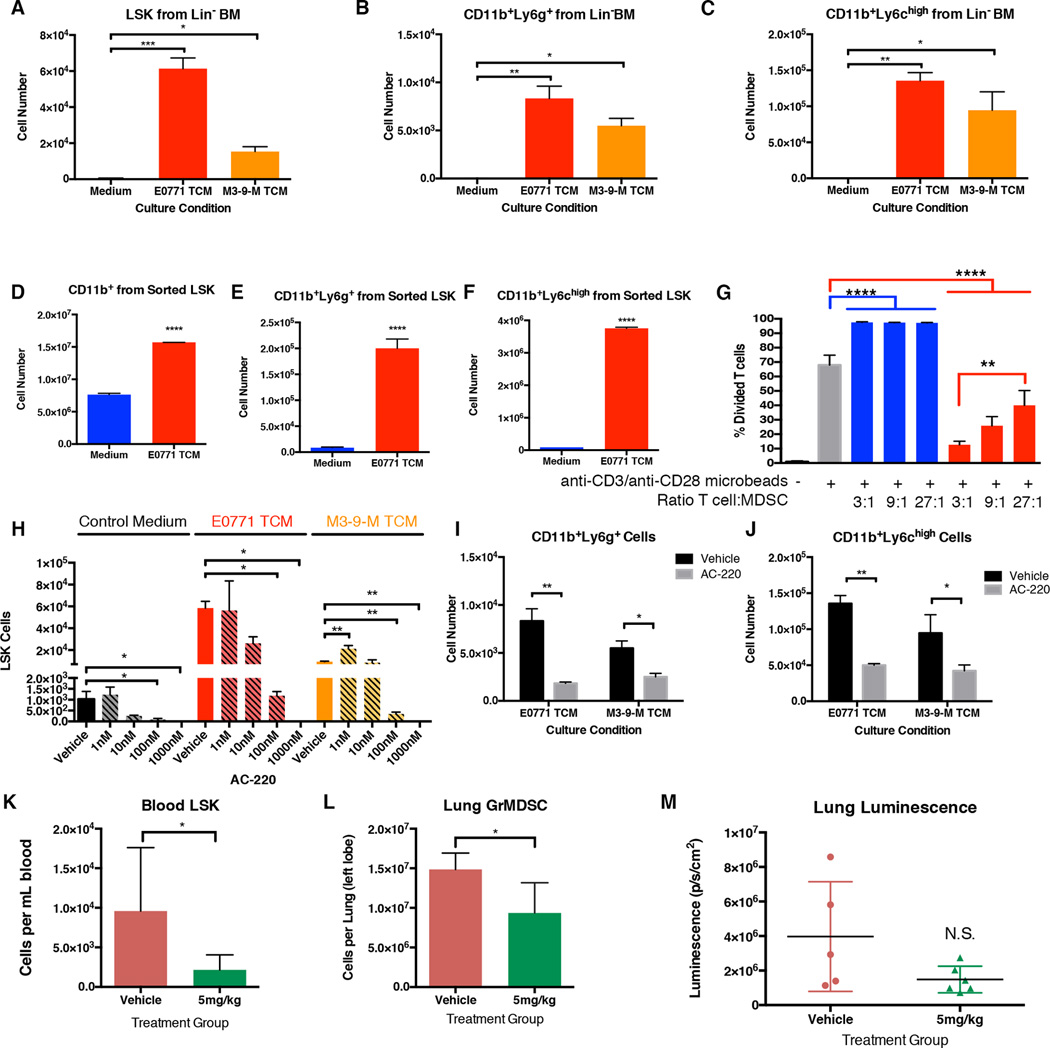
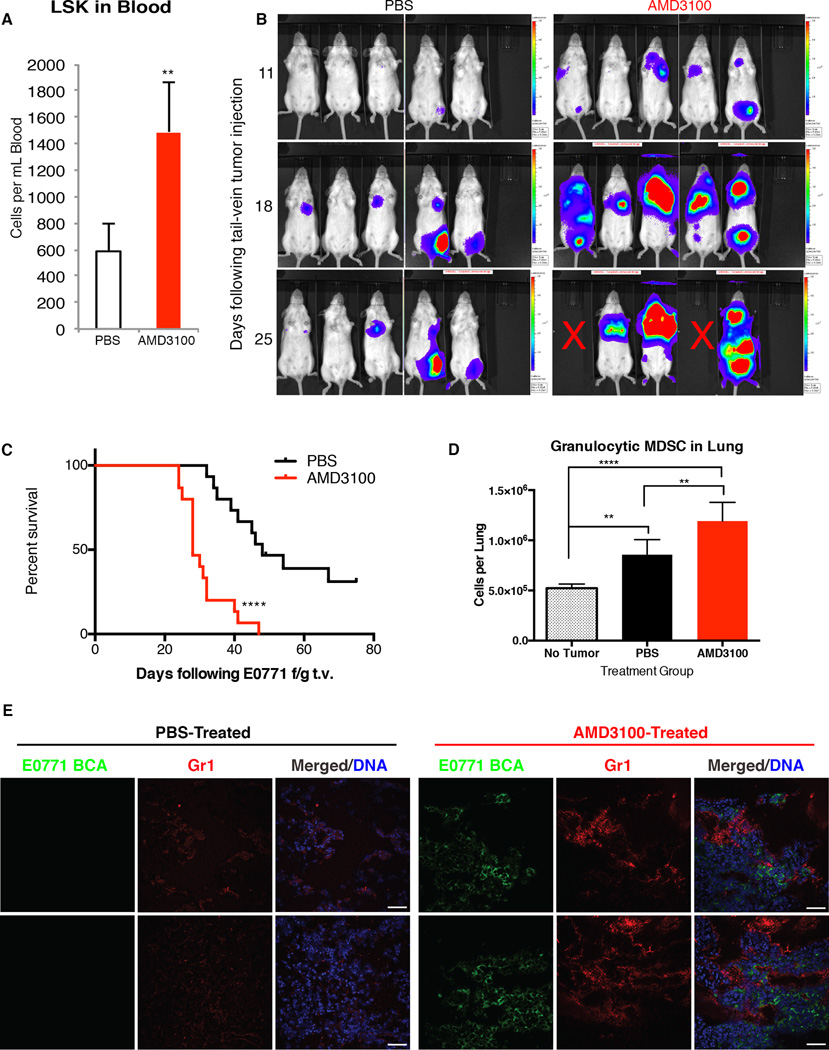
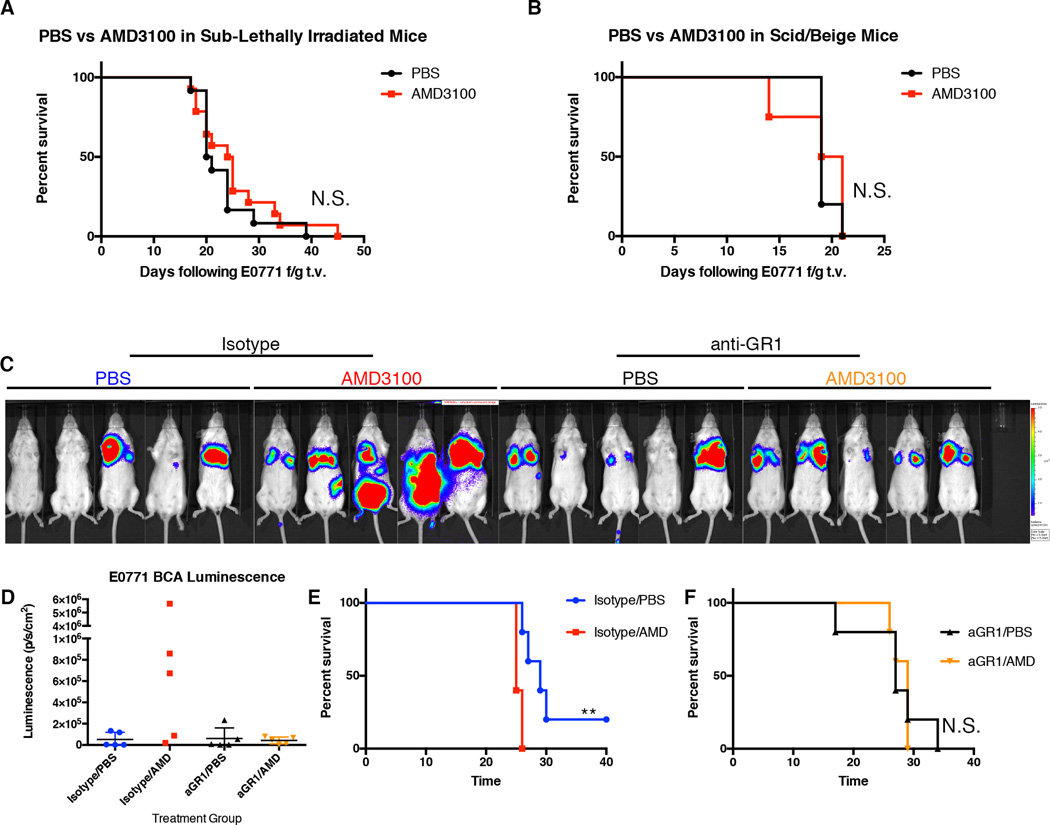
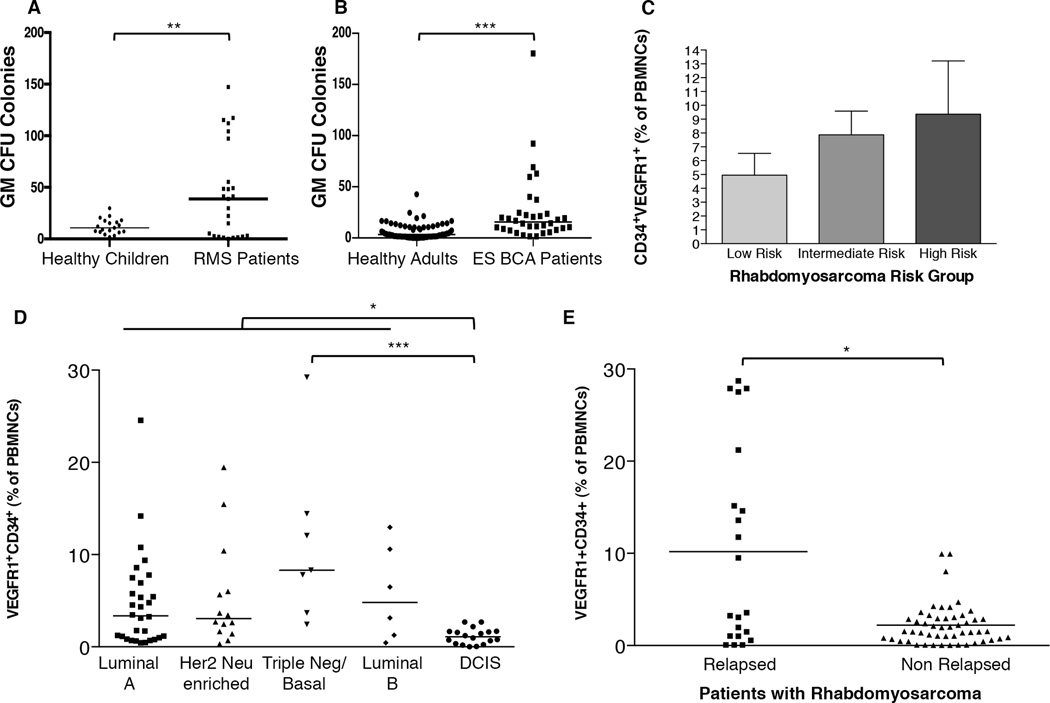
Metastatic tumors have been shown to establish microenvironments in distant tissues that are permissive to disseminated tumor cells. Hematopoietic cells contribute to this microenvironment, yet the precise initiating events responsible for establishing the pre-metastatic niche remain unclear. Here, we tracked the developmental fate of hematopoietic stem and progenitor cells (HSPC) in tumor-bearing mice. We show that a distant primary tumor drives the expansion of HSPCs within the bone marrow and their mobilization to the bloodstream. Treatment of purified HSPCs cultured ex vivo with tumor-conditioned media induced their proliferation as well as their differentiation into immunosuppressive myeloid cells. We furthered tracked purified HSPCs in vivo and found they differentiated into myeloid-derived suppressor cells in early metastatic sites of tumor-bearing mice. The number of CD11b(+)Ly6g(+) cells in metastatic sites was significantly increased by HSPC mobilization and decreased if tumor-mediated mobilization was inhibited. Moreover, pharmacologic mobilization of HSPCs increased metastasis, whereas depletion of Gr1(+) cells abrogated the metastasis-promoting effects of HSPC mobilization. Finally, we detected elevated levels of HSPCs in the circulation of newly diagnosed cancer patients, which correlated with increased risk for metastatic progression. Taken together, our results highlight bone marrow activation as one of the earliest steps of the metastatic process and identify circulating HSPCs as potential clinical indicators of metastatic niche formation.


Conflict of interest statement

Potential Conflict of Interest: The authors declare that there are no conflicts of interest related to this work.

Figures

Figure 1
Figure 1. Primary tumor increases stem cell subsets in bone marrow
A. Representative flow cytometry plots of RBC-lysed total bone marrow previously gated to exclude doublets, dead cells, and lineage positive cells. HBSS control or E0771 BCA tumor-bearing mice at the indicated times post-orthotopic injection are shown. B. Flow cytometry analysis of VEGFR1 expression on LSK-gated bone marrow. C. Quantification of LSK cells per femur of control or E0771 BCA tumor-bearing mice at the indicated times following tumor implantation. (n=10 for no tumor mice; n=5–10 for each tumor-bearing mouse group) D. Quantification of LSK cells per femur of control or M3-9-M ERMS tumor-bearing mice at the indicated times following tumor implantation. (n=11 for no tumor mice; n=4–9 for each tumor-bearing mouse group) E. Total number of LSK that had incorporated BrdU in control mice or mice bearing E0771 BCA orthotopic tumors for 12 days. (n=5 per group) F. Percentage of the LSK population that had incorporated BrdU in control or E0771 BCA tumor-bearing mice 12 days following orthotopic tumor implantation. (n=5 per group) G–I. Quantification of hematopoietic stem cell subsets per femur of control or E0771 BCA tumor-bearing mice at the indicated times following tumor implantation. (n=10 for no tumor mice; n=5–10 for each tumor-bearing mouse group) J–L. Quantification of hematopoietic subsets per femur of control or M3-9-M ERMS tumor-bearing mice at the indicated times following tumor implantation. (n=11 for no tumor mice; n=4–9 for each tumor-bearing mouse group) *P<0.05; **P<0.005; ***P<0.005.
Figure 2
Figure 2. LSK HSPCs are mobilized and develop into immune suppressive myeloid cells in tumor-bearing mice
A. LSK cells per mL of total live RBC-lysed blood from HBSS control or E0771 tumor-bearing mice. (n=12 for control mice; n=4 for each tumor-bearing mouse group) B. LSK cells per mL of total live RBC-lysed blood in HBSS control or M3-9-M tumor-bearing mice. (n=6 mice per group) C. CFU colony counts of circulating blood from mice without tumor or bearing E0771 tumor for 12 days. (n=6 mice per group; blood from each mouse plated in duplicate) D–G. Flow cytometry sorted LSK cells from bone marrow of E0771 BCA tumor-bearing CD45.1 donor mice were intravenously injected into either control or E0771 BCA tumor-bearing CD45.2 recipients. Tissues were harvested 24 hours following injection of LSK cells and analyzed by flow cytometry. D. Number of CD45.1+ donor cells detected in the indicated tissues of control or E0771 BCA tumor-bearing recipients. (n=5 mice per group) E–G. Flow cytometry analysis of CD45.1+ donor-derived cells in lungs of control or pre-metastatic E0771 BCA tumor-bearing recipient mice to quantify CD11b+ cells (B), CD11b+Ly6g+ cells (C), and CD11b+Ly6chi cells (D) that differentiated from transferred LSK cells. (n=5 mice per group) H. Immunofluorescence of lungs stained with the indicated antibodies (CD11b, Gr-1, GFP) and DAPI and imaged under 63× magnification. Scale bar is 10µm. I. Diff-Quik staining of cytospins from flow cytometry sorted CD11b+Gr-1+ cells from IVIS-negative E0771 ffluc-GFP tumor-bearing mice. Scale bar is 10µm. J. T cells were incubated with the indicated ratio of CD11b+Gr-1+ cells isolated from IVIS negative lungs of E0771 ffluc-GFP tumor-bearing mice and stimulated with anti-CD3/anti-CD28 microbeads. T cell division was assessed by Cell Trace Violet dilution after four days. Error bars represent the standard deviation for each group (n=5 replicates). K. Anti-CD3/anti-CD28-stimulated T cells were incubated with CD11b+Gr-1+ cells at a 3:1 ratio with the indicated small molecule inhibitors. T cell proliferation was assessed as in H. Each sample represents n=5 replicates, nor-NOHA (arginase inhibitor), L-NMMA (iNOS inhibitor). Percent suppression is relative to T cells incubated with anti-CD3/anti-CD28 microbeads only. *P<0.05; **P<0.005; ***P<0.005.
Figure 3
Figure 3. Tumor-derived factors expand LSK and promote myeloid development
A–C. Flow cytometry analysis of lineage-depleted bone marrow cells after seven days of culture with control medium or medium conditioned by E0771 BCA (E0771 TCM) or M3-9-M ERMS (M3-9-M TCM). LSK (LineageSca1+CD117+), GrMDSC (CD11b+Ly6g+), and MoMDSC (CD11b+Ly6chi) were quantified. n=2 wells per condition. D–F. Flow cytometry-sorted LSK cells were cultured with control medium or E0771 BCA tumor-conditioned medium (E0771 TCM). The number of CD11b+ (D), CD11b+Ly6g+ (E), or CD11b+Ly6chi (F) produced in culture were quantified by flow cytometry. n=3 wells per condition. G. Cultured cells from sorted LSK in (D–F) were incubated at the indicated ratio with anti-CD3/anti-CD28-stimulated T cells. T cell division was assessed by CellTrace Violet dilution of CD3+ cells. n=3 wells per condition. H. Lineage-depleted bone marrow were cultured with control medium, E0771 BCA TCM, or M3-9-M ERMS TCM for 7 days. Vehicle or the FLT3 inhibitor AC-220 were added at the indicated concentration. LSK cells were quantified by flow cytometry analysis. n=2 wells per condition. I–J. Lineage-depleted bone marrow were cultured with E0771 BCA TCM or M3-9-M ERMS TCM for 7 days with vehicle or 100nM AC-220. CD11b+Ly6g+ (I) and CD11b+Ly6chigh cells (J) were quantified by flow cytometry analysis. n=2 wells per condition. K–L. Mice bearing E0771 BCA primary tumors were treated daily with vehicle or AC-220. Mice were euthanized on treatment day 8. LSK cells were quantified in circulating blood (K), and CD11b+Ly6g+ cells were quantified in lung (L). M. Luminescence of dissected lungs from mice in K–L. n=5 (control) and 7 (5mg/kg) mice per group. *P<0.05; **P<0.005; ***P<0.005.
Figure 4
Figure 4. Mobilization of LSK cells by AMD3100 enhances experimental metastasis
A. Mice were injected with PBS or AMD3100 and blood samples taken one hour after injection. Circulating LSK HSPCs were quantified by flow cytometry (n=5 mice per group). B. Mice were injected with PBS (Control) or AMD3100. One hour following treatment, E0771 ffluc-eGFP tumor cells were injected via tail vein. IVIS images were acquired at the indicated times following tail-vein injection of tumor cells. C. Survival of mice pre-treated with PBS or AMD3100 followed by tail-vein injection of E0771-ffluc-GFP tumor cells as in (B) (data are combined from 3 independent experiments of n=5 mice per group). D. Flow cytometry analysis of CD11b+Ly6g+ cells in lungs from mice that received no tail-vein tumor or E0771 ffluc-eGFP tail vein tumor 1 hour following treatment as in B-C. Lungs were analyzed 14 days following tumor injection. (n=5 mice per group) E. Representative immunofluorescence of lungs from mice in the indicated treatment group and tail-vein injected with E0771 ffluc-eGFP. Lung sections were stained with the indicated antibodies (GFP for tumor, Gr1) and DRAQ5 for nuclear detection. Images acquired with 40× magnification. Scale bar is 50µm.
Figure 5
Figure 5. Promotion of experimental metastasis by AMD3100 requires an intact immune system
A. Survival of mice that had received sub-lethal irradiation prior to treatment with PBS or AMD3100. One hour after PBS or AMD3100 treatment mice received tail-vein injection of E0771 ffluc-GFP tumor. (n=5 mice per group) B. Survival of SCID/Beige mice treated with PBS or AMD3100 followed by tail-vein injection of E0771 ffluc-GFP tumor one hour following treatment. (n-=5 mice per group). C. Luminescence images of mice that were administered anti-Gr-1 antibody or isotype antibody 24 hours before treatment with PBS or AMD3100. E0771ffluc-eGFP tumor cells were administered by tail-vein injection 1 hour following PBS or AMD3100 treatment. IVIS images were taken two weeks following injection of tumor. D. Quantification of total body luminescence from mice in (C). E–F. Survival of mice administered isotype antibody followed by AMD3100 or PBS (E) and mice administered anti-Gr-1 antibody followed by AMD3100 or PBS (F).
Figure 6
Figure 6. Elevated circulating progenitor cells in patients with cancer predict metastatic risk
A. GM colony forming units per 100,000 peripheral blood mononuclear cells (PBMNCs) from blood of healthy control children (n=19) or patients with rhabdomyosarcoma (n=25) at time of diagnosis. B. GM colony forming units per 100,000 PBMNCs of healthy control adults (n=68) or patients with early stage breast cancer at time of diagnosis (ES BCA, n=34). C. Flow cytometry analysis of circulating VEGFR1+CD34+ progenitor cells analyzed at time of diagnosis correlate with metastatic risk of rhabdomyosarcoma patients (n=5 for low risk; n=20 for intermediate risk; n=25 for high risk). D. Circulating VEGFR1+CD34+ progenitor cells analyzed at time of diagnosis correlate with metastatic risk of patients with early stage breast cancer (n=30 for luminal A; n=14 for Her 2 Neu enriched; n=7 for triple negative/basal; n=6 for luminal B; n=18 for DCIS). I. Elevated circulating VEGFR1+CD34+ progenitor cells in rhabdomyosarcoma patients at time of diagnosis predicts metastatic relapse. *P<0.05; **P<0.005; ***P<0.005.

References

    1. Wan L, Pantel K, Kang Y. Tumor metastasis: moving new biological insights into the clinic. Nature medicine. 2013;19(11):1450–1464. - PubMed
    1. Joyce JA, Pollard JW. Microenvironmental regulation of metastasis. Nature reviews Cancer. 2009;9(4):239–252. - PMC - PubMed
    1. Lander AD, Kimble J, Clevers H, Fuchs E, Montarras D, Buckingham M, et al. What does the concept of the stem cell niche really mean today? BMC biology. 2012;10:19. - PMC - PubMed
    1. Bhat R, Bissell MJ. Of plasticity and specificity: dialectics of the microenvironment and macroenvironment and the organ phenotype. Wiley interdisciplinary reviews Developmental biology. 2014;3(2):147–163. - PubMed
    1. Littlepage LE, Egeblad M, Werb Z. Coevolution of cancer and stromal cellular responses. Cancer cell. 2005;7(6):499–500. - PubMed

MeSH terms