

Correlation of (18)F-fluoroethyl tyrosine positron-emission tomography uptake values and histomorphological findings by stereotactic serial biopsy in newly diagnosed brain tumors using a refined software tool
- PMID: 26719708
- PMCID: PMC4689263
- DOI: 10.2147/OTT.S87126
Correlation of (18)F-fluoroethyl tyrosine positron-emission tomography uptake values and histomorphological findings by stereotactic serial biopsy in newly diagnosed brain tumors using a refined software tool
Abstract
Background: Magnetic resonance imaging (MRI) is the standard neuroimaging method to diagnose neoplastic brain lesions, as well as to perform stereotactic biopsy surgical planning. MRI has the advantage of providing structural anatomical details with high sensitivity, though histological specificity is limited. Although combining MRI with other imaging modalities, such as positron-emission tomography (PET), has proven to increment specificity, exact correlation between PET threshold uptake ratios (URs) and histological diagnosis and grading has not yet been described.
Objectives: The aim of this study was to correlate exactly the histopathological criteria of the biopsy site to its PET uptake value with high spatial resolution (mm(3)), and to analyze the diagnostic value of PET using the amino acid O-(2-[(18)F]fluoroethyl)-l-tyrosine ((18)F-FET) PET in patients with newly diagnosed brain lesions in comparison to histological findings obtained from stereotactic serial biopsy.
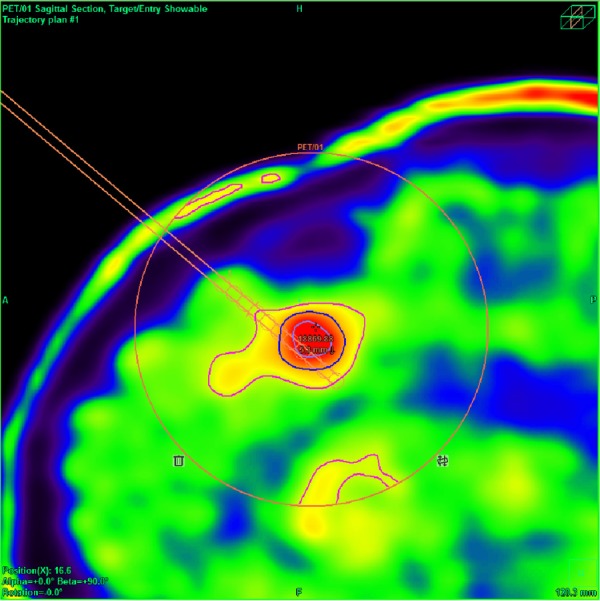
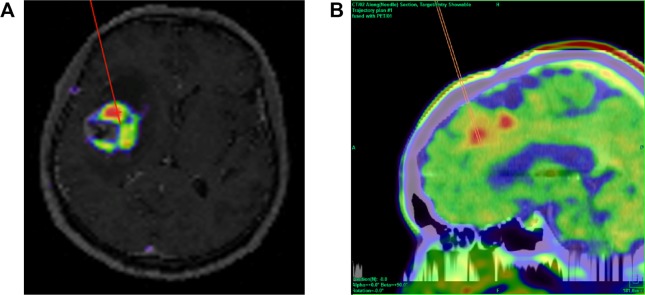
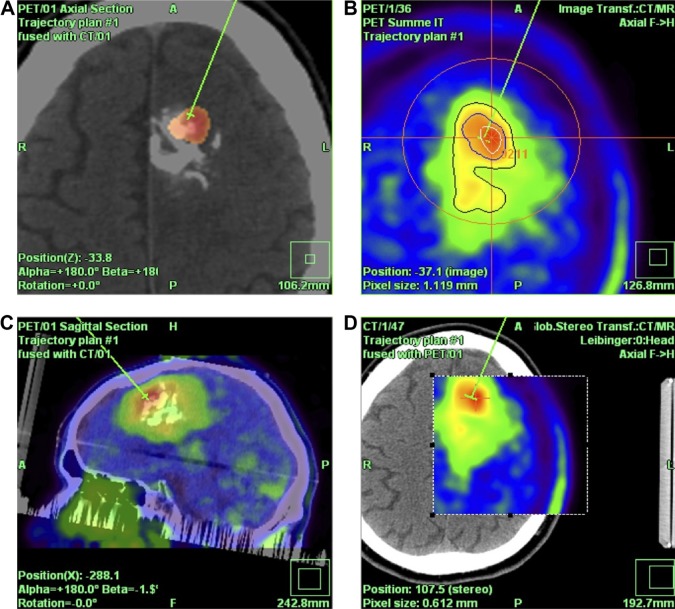
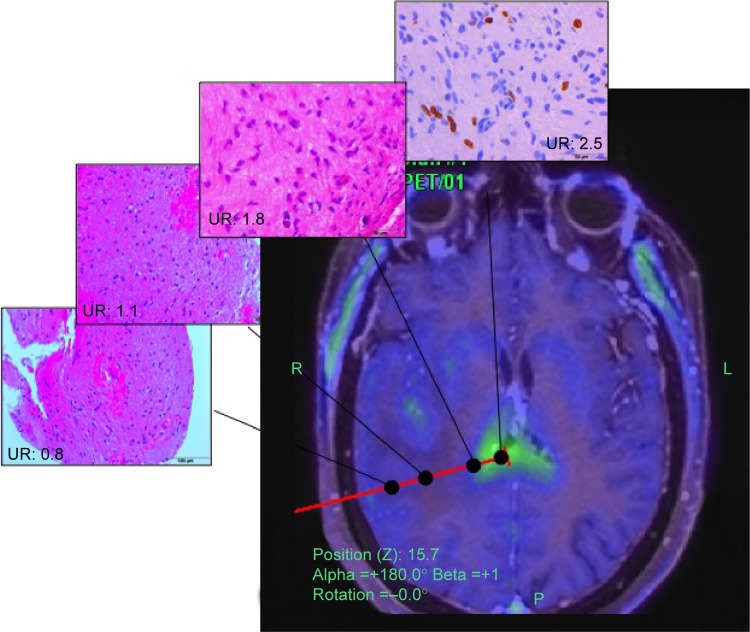
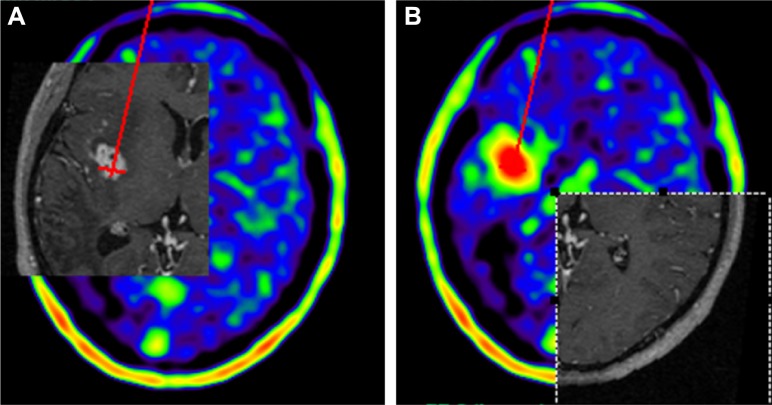
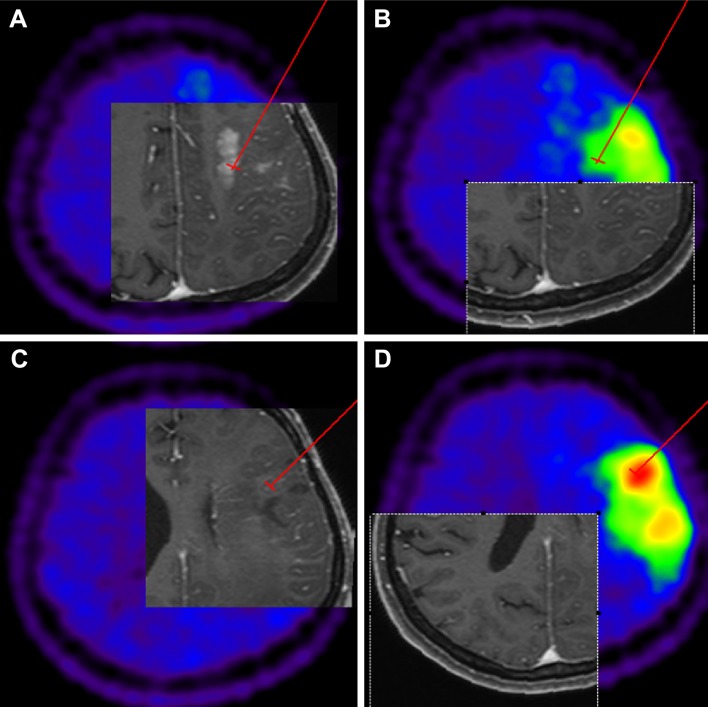
Patients and methods: A total of 23 adult patients with newly diagnosed brain tumors on MRI were enrolled in this study. Subsequently to diagnoses, all patients underwent a (18)F-FET PET-guided stereotactic biopsy, using an original newly developed software module, which is presented here. Conventional MRI, stereotactic computed tomography series, and (18)F-FET PET images were semiautomatically fused, and hot-spot detection was performed for target planning. UR was determined using the uptake value from the biopsy sites in relation to the contralateral frontal white matter. UR values ≥1.6 were considered positive for glioma. High-grade glioma (HGG) was suspected with URs ≥3.0, while low-grade glioma (LGG) was suspected with URs between 1.6 and 3.0. Stereotactic serial biopsies along the trajectory at multiple sites were performed in millimeter steps, and the FET URs for each site were correlated exactly with a panel of 27 different histopathological markers. Comparisons between FET URs along the biopsy trajectories and the histological diagnoses were made with Pearson product-moment correlation coefficients. Analysis of variance was performed to test for significant differences in maximum UR between different tumor grades.
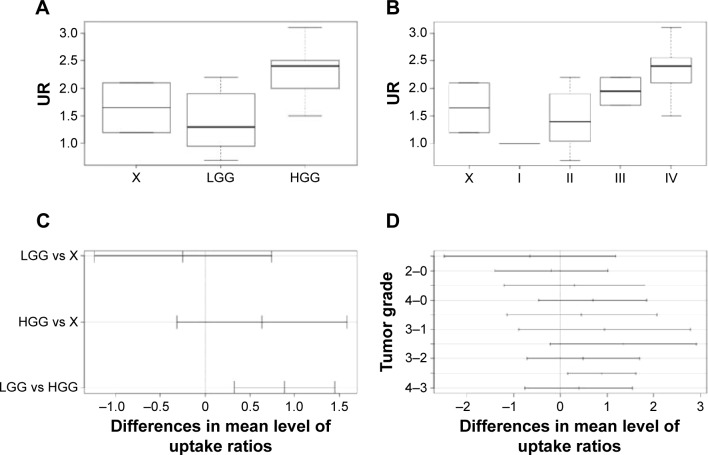
Results: A total of 363 biopsy specimens were taken from 23 patients by stereotactic serial biopsies. Histological examination revealed eight patients (35%) with an LGG: one with a World Health Organization (WHO)-I lesion and seven with a WHO-II lesion. Thirteen (57%) patients revealed an HGG (two with a WHO-III and three with a WHO-IV tumor), and two patients (9%) showed a process that was neither HGG nor LGG (group X or no-grade group). The correlation matrix between histological findings and the UR revealed five strong correlations. Low cell density in tissue samples was found to have a significant negative correlation with the measured cortical uptake rate (r=-0.43, P=0.02), as well as moderate cell density (r=-0.48, P=0.02). Pathological patterns of proliferation (r=0.37, P=0.04), GFAP (r=0.37, P=0.04), and Olig2 (r=0.36, P=0.05) showed a significant positive correlation with cortical URs. Analysis of variance tests showed a significant difference between the LGG and the HGG groups (F=8.27, P<0.002), but no significant differences when differentiating between the X group and the HGG (P=0.2)/LGG (P=0.8) groups, nor between the no-grade group and the WHO-I group.
Conclusion: (18)F-FET PET is a valuable tool, as it allows the differentiation of HGGs from LGGs. Its use is not limited to preoperative evaluation; it may also refine biopsy targeting and improve tumor delimitation for radiotherapy. Histology is still necessary, and remains the gold standard for definitive diagnosis of brain lesions.
Keywords: 18F-FET PET-guided stereotactic biopsy; biopsy target; diagnostic and treatment management of cerebral gliomas; newly developed software module; newly diagnosed brain lesions; stereotactic serial biopsy.
Figures
Similar articles
-
Diagnostic performance of 18F-FET PET in newly diagnosed cerebral lesions suggestive of glioma.J Nucl Med. 2013 Feb;54(2):229-35. doi: 10.2967/jnumed.112.109603. Epub 2012 Dec 11. J Nucl Med. 2013. PMID: 23232275
-
The diagnostic accuracy of detecting malignant transformation of low-grade glioma using O-(2-[18F]fluoroethyl)-l-tyrosine positron emission tomography: a retrospective study.J Neurosurg. 2018 Apr 6;130(2):451-464. doi: 10.3171/2017.8.JNS171577. Epub 2018 Apr 6. J Neurosurg. 2018. PMID: 29624154
-
Integrated analysis of dynamic FET PET/CT parameters, histology, and methylation profiling of 44 gliomas.Eur J Nucl Med Mol Imaging. 2018 Jul;45(9):1573-1584. doi: 10.1007/s00259-018-4009-0. Epub 2018 May 7. Eur J Nucl Med Mol Imaging. 2018. PMID: 29732524
-
Amino acid tracers in PET imaging of diffuse low-grade gliomas: a systematic review of preoperative applications.Acta Neurochir (Wien). 2018 Jul;160(7):1451-1460. doi: 10.1007/s00701-018-3563-3. Epub 2018 May 24. Acta Neurochir (Wien). 2018. PMID: 29797098 Free PMC article.
-
Comparison Between 18F-Dopa and 18F-Fet PET/CT in Patients with Suspicious Recurrent High Grade Glioma: A Literature Review and Our Experience.Curr Radiopharm. 2019;12(3):220-228. doi: 10.2174/1874471012666190115124536. Curr Radiopharm. 2019. PMID: 30644351 Review.
Cited by
-
The Role of Standard and Advanced Imaging for the Management of Brain Malignancies From a Radiation Oncology Standpoint.Neurosurgery. 2019 Aug 1;85(2):165-179. doi: 10.1093/neuros/nyy461. Neurosurgery. 2019. PMID: 30535032 Free PMC article. Review.
-
Glioma Biopsy Based on Hybrid Dual Time-Point FET-PET/MRI-A Proof of Concept Study.Front Neurol. 2021 May 11;12:634609. doi: 10.3389/fneur.2021.634609. eCollection 2021. Front Neurol. 2021. PMID: 34046002 Free PMC article.
-
PET Molecular Imaging-Directed Biopsy: A Review.AJR Am J Roentgenol. 2017 Aug;209(2):255-269. doi: 10.2214/AJR.17.18047. Epub 2017 May 15. AJR Am J Roentgenol. 2017. PMID: 28504563 Free PMC article. Review.
-
Biopsy targeting with dynamic contrast-enhanced versus standard neuronavigation MRI in glioma: a prospective double-blinded evaluation of selection benefits.J Neurooncol. 2017 May;133(1):155-163. doi: 10.1007/s11060-017-2424-x. Epub 2017 Apr 19. J Neurooncol. 2017. PMID: 28425048
-
The Emerging Role of Amino Acid PET in Neuro-Oncology.Bioengineering (Basel). 2018 Nov 28;5(4):104. doi: 10.3390/bioengineering5040104. Bioengineering (Basel). 2018. PMID: 30487391 Free PMC article. Review.
References
-
- Minn Y, Bondy M, Wrensch M. Epidemiology. In: Bernstein M, Berger MS, editors. Neurooncology: The Essentials. 2nd ed. Stuttgart: Thieme Medical Publishers; 2008. pp. 3–17.
-
- Chandrasoma PT, Smith MM, Apuzzo ML. Stereotactic biopsy in the diagnosis of brain masses: comparison of results of biopsy and resected surgical specimen. Neurosurgery. 1989;24(2):160–165. - PubMed
-
- Feiden W, Steude U, Bise K, Gündisch O. Accuracy of stereotactic brain tumor biopsy: comparison of the histologic findings in biopsy cylinders and resected tumor tissue. Neurosurg Rev. 1991;14(1):51–56. - PubMed
LinkOut - more resources
Full Text Sources
Miscellaneous
